Download
1 / 39
450 likes | 630 Views
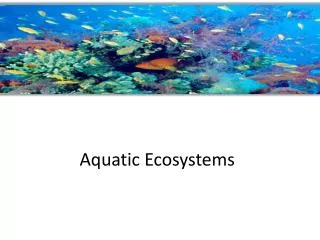
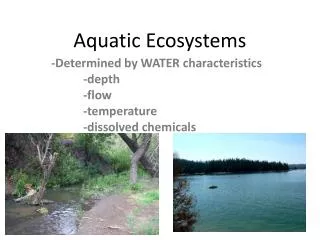
Assessing Aquatic Ecosystems. Aquatic Ecosystem Assessment. The health of an aquatic ecosystem can be determined by examining a variety of factors, including: Water quality (physical & chemical parameters) Aquatic macroinvertebrates Habitat.

E N D
Aquatic Ecosystem Assessment • The health of an aquatic ecosystem can be determined by examining a variety of factors, including: • Water quality (physical & chemical parameters) • Aquatic macroinvertebrates • Habitat
USGS: Water Science for Schools - http://ga.water.usgs.gov/edu/waterquality.html Sources of Contamination
Water Quality • Physical • Flow, turbidity, temperature • Chemical • Dissolved oxygen (D.O.) • pH • Alkalinity • Conductivity • Phosphorous • Nitrates • Chlorine and chloride
Stream flow • Volume of water moving across a specific point over a period of time (ft3/sec) • Related to amount of water moving off the watershed into stream
Stream flow • Affected by: • Weather • Seasons (usually lowest in Aug. & Sept.) • Water withdrawal • Stream flow affects: • Ability to dilute pollution • Kinds of organisms living in stream
Turbidity • Measure of water clarity • Based on suspended material in water (soil, plankton, microbes, etc.)
Turbidity • Affected by: • Weather • Stream flow & velocity • Erosion • Run-off & discharge • Excessive algal growth
Turbidity • Turbidity has an effect on: • Water color & light penetration • Temperature & dissolved oxygen • Survival of fish & invertebrates
Measuring Turbidity • Measured using Secchi disk or transparency tube
Temperature • Optimal temp. range depends on species • Temp. of lower order streams is usually < 20°C • Affected by: • Weather & seasons • Riparian vegetation • Water sources & discharges
Temperature • Temp. affects: • Rate of biological & chemical reactions • Dissolved oxygen levels • Sensitivity of aquatic life
Dissolved Oxygen (DO) • Affected by: • Temperature • Stream flow • Turbidity • Photosynthesis & Respiration • Decomposition • Input of organic material
Dissolved Oxygen (DO) • Most aquatic life requires DO levels of 5 - 6 ppm to thrive • Levels < 3 ppm are stressful
Biological Oxygen Demand (BOD) • Measure of: • oxygen consumed by microbes for decomposition • oxygen required for oxidation of inorganic matter • High BOD rapid oxygen depletion death of organisms • Levels of 1-2 ppm are very good • Sources: organic matter, effluent, and runoff
pH • Measure of the alkalinity or acidity of the water • Tolerance varies based on species • Optimal range for most aquatic life is a pH of 6.5 – 8.0
pH • Affected by: • Stream geology • Alkalinity • Acid precipitation • Wastewater discharges • Mining of coal or metals
pH • pH has an effect on: • Biological and chemical processes • Solubility of elements & compounds • Survival of aquatic life
Alkalinity • Measure of the buffering capacity • Helps maintain pH of stream • Highly dependent on stream geology • Produced by leaching of carbonate/bicarbonate from rocks • Levels between 100 – 200 ppm will stabilize pH
Conductivity • General measure of water quality • Related to ion concentration • Affected by: • Geology of stream • Discharges to stream (ex: sewage) • U.S. streams range from 50–1500 µs/cm • 150–500 µs/cm good range for most fish & macroinvertebrates
Phosphorous • Essential nutrient for plants, algae, and animals • Phosphorous is usually found as part of phosphate (PO4) • Aquatic ecosystems have both inorganic and organic PO4 • Plants require inorganic PO4; animals can use both
The Phosphorous Cycle Tri-C Eastern Campus BIO 2806 - Environmental Science for Educators: Promoting Watershed Stewardship July 2007
Phosphorous • Usually in short supply in aquatic ecosystems • Unpolluted waters < 0.03 mg/L • Critical level is 0.1 mg/L • Sources of phosphorous: • Soils and rocks • Decomposition • Wastewater • Run-off (fertilizers and waste)
Eutrophication • Increased phosphorous can lead to overgrowth of algae & aquatic plants… …which leads to a chain of events that ends in oxygen depletion.
Nitrates • A form of nitrogen found in aquatic ecosystems in the following forms: ammonia (NH3), nitrates (NO3), nitrites (NO2) • Nitrates are an essential nutrient for plants and algae • Natural levels in water < 1 mg/L
The Nitrogen Cycle Tri-C Eastern Campus BIO 2806 - Environmental Science for Educators: Promoting Watershed Stewardship July 2008
High levels along w/ phosphorous can lead to eutrophication Sources of nitrates: Decomposition & wastes Wastewater Run-off (waste & fertilizers) Nitrates
Chlorine & Chloride • Low levels of chloride may be found naturally (<16 mg/L is normal) • Sources of chloride: • Soil & rocks • Decomposition & wastes • Street salt, wastewater, industry • Chlorine should not be present • Indicates input from municipal water source
Other Water Quality Concerns • Metals (copper, iron, mercury, etc.) • Pesticides • Organics (PCBs, PAHs, etc.) • Fecal coliform bacteria
Macroinvertebrates as Indicators of Watershed Health • Why macroinvertebrates? • Live in water most/all of their lives • Important part of an aquatic ecosystem • Provide water quality info. over time • Easy to collect and identify • Have varying levels of tolerance to pollution • “Canaries of the stream”
Levels of Tolerance • Level 1 - Pollution Sensitive (“Indicator Species”) • Level 2 - Moderately Tolerant • Level 3 - Pollution Tolerant • EPA – Invertebrates as Indicators
Identifying Aquatic Macroinvertebrates • Key to Macroinvert. Life in the River • Key to the Orders of Benthic Insects • Aquatic Macroinvertebrate Key • EEK! – Water Critter Key Tri-C Eastern Campus BIO 2806 - Environmental Science for Educators: Promoting Watershed Stewardship July 2008
Assessing Water Quality using Aquatic Macroinvertebrates • Simplified Stream Biota Test (SSBT) • Simplest method for assessing health • Looks for sensitive benthos (stoneflies, mayflies, & caddisflies) Tri-C Eastern Campus BIO 2806 - Environmental Science for Educators: Promoting Watershed Stewardship July 2008
Assessing Water Quality using Aquatic Macroinvertebrates • Index of Biotic Integrity (IBI) • More involved, but more precise • Requires more organisms (~100) • Based on species richness, species dominance, and indicator species Tri-C Eastern Campus BIO 2806 - Environmental Science for Educators: Promoting Watershed Stewardship July 2008
Alternative Macroinvertebrate Activities • Leaf Pack Network • Diversity: A Stream Study Environmental Impact Simulation • Is There Mine Drainage Impacting This Stream? Tri-C Eastern Campus BIO 2806 - Environmental Science for Educators: Promoting Watershed Stewardship July 2008
Habitat Assessment • Should be performed along with biological sampling • Habitat diversity is linked to biological diversity • Can provide clues about macroinvertebrates • Both instream and riparian habitat should be examined
Habitat Assessment • Virginia Save Our Streams Habitat Assessment • EPA Habitat Assessment