Download
1 / 25
250 likes | 255 Views
Learn how to interpret patterns of cumulus clouds to gather information about surface and upper air features over the ocean. Discover techniques for locating thermal troughs, upper short-wave troughs, jet-stream axes, and surface ridges.

E N D
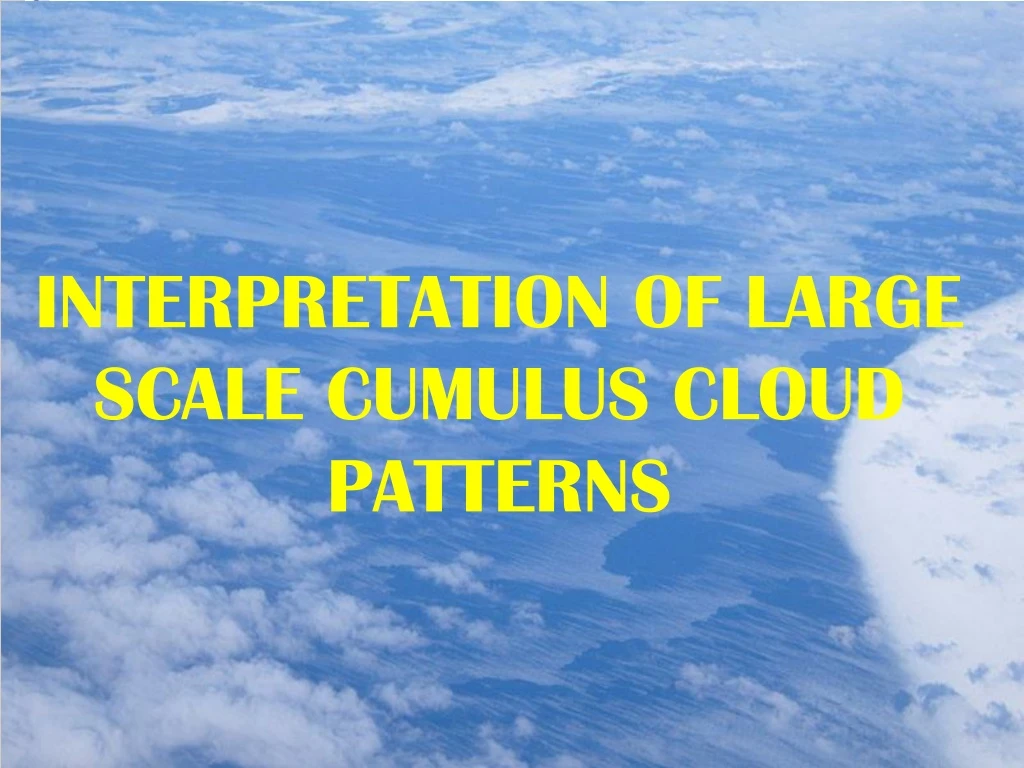
INTERPRETING PATTERNS OF CU CLOUDS • Cu cloud patterns provide info about surface and UA features over the ocean in areas of CA. • Provide info about :- • Locating thermal troughs • Locating upper short-wave troughs • Locating jet-stream axes • Locating surface ridges
LOCATING THERMAL TROUGHS Fig 1(a) ERICA storm # 4 at 1331 UTC on 04 Jan 89 : Vis image superimposed with 1000-500hPa at 12 gdm intervals
LOCATING THERMAL TROUGHS (b) Enhanced IR image with 500 hPa heights superimposed at 12 gdm intervals
LOCATING THERMAL TROUGHS Surface Analysis
LOCATING THERMAL TROUGHS • Thermal troughs (as defined by the 1000-500hpa thickness pattern) are associated with large scale oceanic cyclones • Can be located using the cumuliform cloud pattern in areas of CA. • Fig. 1 shows an intense marine cyclone investigated in ERICA project (Hadlock and Kreitberg, 1988). • The axis of the coldest air (A-B-C) extends through the area of open cell having the largest diameter, thickest cloud walls and coldest tops.
LOCATING THERMAL TROUGHS • If the instability is extreme through a deep layer, the open cell pattern becomes obscured (such as at D, which is over the warm waters of the Gulf Stream). • Closed cell appear at E, aligned with the strong surface wind flow. • They occur most often downwind of upper troughs where PVA is a maximum.
LOCATING THERMAL TROUGHS • Areas of enhanced Cu, usually in a northwesterly flow, are associated with a PVA area and a shallow surface trough where no closed surface low has yet developed. • On the jet side (or just to the rear) of the enhanced Cu pattern, stronger surface wind are often present. • Fig.2 gives an example of an area of enhanced cumuliform cloud (labelled A) in a trough with a relative weak flow. • Fig.3 shows enhanced cumuliform cloud (A) in strong flow.
LOCATING THERMAL TROUGHS Fig 2 GOES IR image at 1200 UTC on 22 May 90 showing enhances convective cloud in a trough with weak low level flow . Enhanced convective cloud is atA. Solid lines are isobars and dashed lines are 1000-00hPa thickness in gdm. Thick dashed line is a surface trough.
LOCATING THERMAL TROUGHS Fig 3
LOCATING THERMAL TROUGHS Fig 4(a) : Cumuliform cloud pattern in a confluent thermal trough at 1800 UTC on 17 Dec 91 Meteosat Vis image
LOCATING THERMAL TROUGHS Fig 4(b) : Cumuliform cloud pattern in a confluent thermal trough at 1800 UTC on 17 Dec 91 Meteosat IR image
LOCATING THERMAL TROUGHS Fig 4(c) : Surface analysis and (dashed) 1000-500hPa thickness(gdm). There is strong vertical shear at V
LOCATING THERMAL TROUGHS • Fig.4 shows cumuliform cloud in a strong low-level flow with no enhanced area of convection. • In this case the thermal trough was confluent. • The strong vertical shear within the convective layer is seen to the west of the frontal cloud band (at V) in the elements lying southwest to northwest, almost parallel to the thickness lines.
ENHANCED CLOUD MODEL :DIFFLUENT THERMAL TROUGH Fig.5: Red dashed lines are thickness. The circled cross indicates the vorticity centre
LOCATING UPPER SHORT-WAVE TROUGHS • Short-wave upper troughs in northwesterly airflows, upstream of long-wave troughs, can often be detected by areas of enhanced Cu which develop in regions of open cellular clouds (Fig. 5). • These enhanced Cu have colder cloud tops than the surrounding convective cloud, and the cloud amount increases with time. • These areas are immediately to the cold side of a jet axis in an area of ascent caused by PVA in advance of short-wave upper trough. • The area of enhanced cu is usually 3-5° latitude in diameter.
LOCATING JET-STREAM AXES • When there are no clouds with tops at jet-stream level, the jet axis may often be related to a boundary or interface between different types of low-level cloud, due to the differences in the inversion level. • The temperature of the cloud tops will be higher on the warm air side of the jet-stream axis. • The reasons for the differences in cloud structure result from the differences in stability of the air on the air on the either side of the jet, the air being more unstable on the cold side, resulting in more and/or deeper convective cloud.
LOCATING JET-STREAM AXES Surface Isobar Fig.6 Fig.6
LOCATING JET-STREAM AXES • The jet-stream axis (Fig.6(a))is approximately parallel to the boundary between open and closed cellular clouds in polar maritime air on the upstream side of an upper trough. • The open cells indicate vigorous convection on the cold side of the jet. • The closed cells indicate that convection is limited by an inversion, caused by subsidence or a lower position of the frontal inversion, and at this level the cloud tends to spread out.
LOCATING JET-STREAM AXES • The jet lies 1-3° poleward of the boundary. This guide-line commonly applies over oceans and is most likely to be helpful when the jet stream is :- • Well defined; • In a channelled configuration (i.e. the contours and vorticity isopleths are parallel); • extends over significant depth.
LOCATING JET-STREAM AXES • Over the land, well marked boundaries in convective cloud are much less frequent because of local variations in available moisture, topographical effects and large diurnal effects. • The jet-stream axis is parallel to the boundary between low Cu clouds on the cold side of the jet and clear skies on the warm side. This rule applies when the flow is cyclonic at low levels.
LOCATING SURFACE RIDGES • Over the oceans, surface high pressure centres cannot be reliably located from cloud imagery. • High pressure area are generally cloud covered, with closed cellular Sc in area of CA on the east side, and low stratiform clouds on the west side where warm air is being advected over cooler sea surfaces. • Over the ocean the cloud type is quite sensitive to sea-air temperature differences, so a knowledge of sea surface temperature and the orientation of the sea surface temperature gradients is helpful in interpreting the cloud patterns. • The pattern will give clues about the low-level wind flow, helping to define area of high pressure and ridge line. Fig.7 shows three areas which illustrate this effect.
LOCATING JET-STREAM AXES (A) Mobile polar ridge (between two migrating depressions L1 and L2): low-level clouds, in the northwesterly flow east of the ridge axis, change from open cellular to closed cellular at the dotted line in Fig. 7. The ridge axis A is approximately parallel to the boundary, several degrees of latitude on the closed cellular side. The ridge is usually very close to the forward edge of the solid overcast from L2 and near where low-level stratifrom cloud clears or changes to cumuliform. (B) Polar air surface ridge: the ridge is located where the convection is reduced as a result of subsidence behind the front. (C) Sub-tropical surface ridge: the ridge is located on the boundary between the trade wind Cu and the stratiform clouds formed where the air flows northwards over colder water.