Download
1 / 9
110 likes | 197 Views
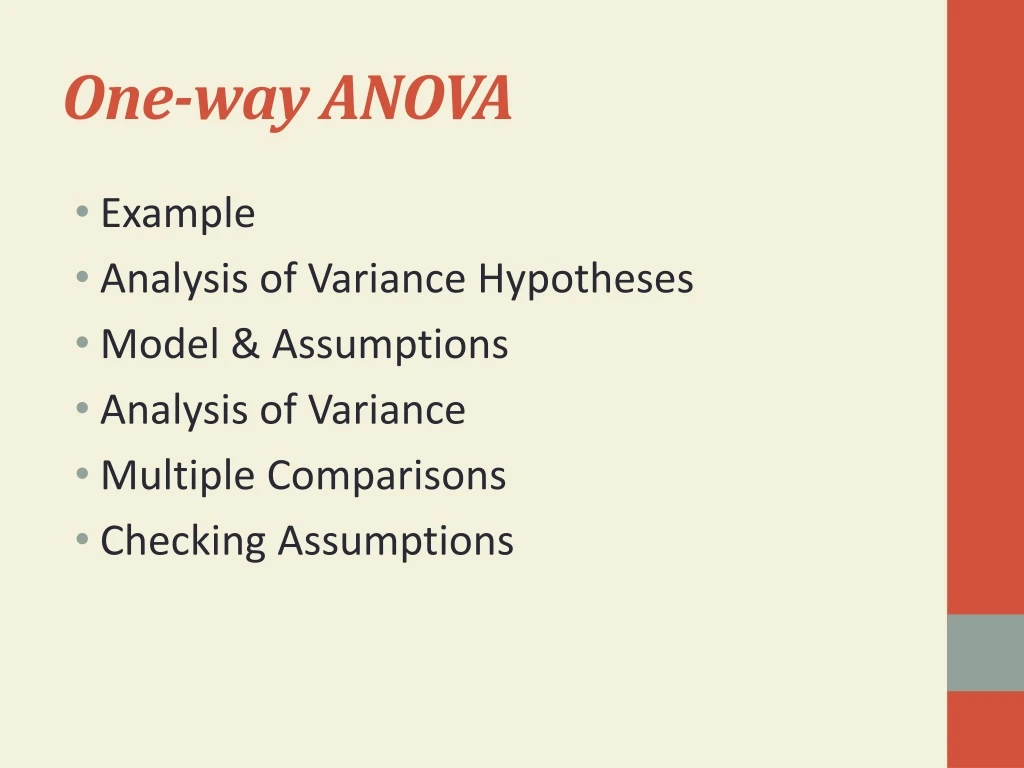
One-way ANOVA. Example Analysis of Variance Hypotheses Model & Assumptions Analysis of Variance Multiple Comparisons Checking Assumptions. Example: Days Absent by Job Type. Analysis of Variance.

E N D
One-way ANOVA • Example • Analysis of Variance Hypotheses • Model & Assumptions • Analysis of Variance • Multiple Comparisons • Checking Assumptions
Analysis of Variance • Analysis of Variance is a widely used statistical technique that partitions the total variability in our data into components of variability that are used to test hypotheses about equality of population means. • In One-way ANOVA, we wish to test the hypothesis: H0: 1= 2= = k against: Ha:Not all population means are the same
Assumptions • Each population being sampled is normally distributed and all populations are equally variable. • Normality can be checked by skewness/kurtosis or normal probability plots. If any of the samples do not look like they come from a normal population the assumption is not met (unless the samples that do not look normal have a large sample size (n>30) • Equal variability can be checked by comparing standard deviations. If no standard deviation is more than 2 times bigger than another equal variability can be assumed.
Example: Are the population mean days absent the same for all 4 job types? H0: μA = μB = μC = μD H1: Not all μ’s are equal We can be almost 100% confident that population mean days absent differ in some way between the 4 job types.
( ) æ ö - k k ! k k 1 ç ÷ = = ç ÷ - 2 2 ! ( k 2 )! 2 è ø Multiple Comparisons • A significant F-test tells us that at least two of the underlying population means are different, but it does not tell us which ones differ from the others. • We need extra tests to compare all the means, which we call Multiple Comparisons. • We look at the difference between every pair of group population means, as well as the p-value for each difference. • When we have k groups, there are: possible pair-wise comparisons. For example 4 groups have 4*3/2 = 6 comparisons.
Multiple Comparisons • If we estimate each comparison separately with 95% confidence, the overall confidence will be less than 95%. • So, using ordinary pair-wise comparisons (i.e. lots of individualt-tests), we tend to find too many significant differences between our sample means. • We need to modify our p-values so that we determine the true differences with 95% confidence across the entire set of comparisons. • These methods are known as: multiple comparison procedures
Multiple Comparisons • We use Tukey simultaneous comparisons. • Tukey simultaneous comparisons overcome the problems of the unadjusted pair-wise comparisons finding too many significant differences (i.e. p-values that are too small).
Tukey Pair-wise Comparisons We can be at least 99% confident that Job Type A has the highest population mean days absent. We can be also more than 99% confident that C and D have a larger population mean days absent than B. We can only be 95% confident that Job Type C has a higher population mean than D.