Download
1 / 32
320 likes | 330 Views
PSYCHOSIS Neuro-Imaging (Schizophrenia and Bipolar disorder) What we know and what we could know. Stephen Lawrie Edinburgh. Why brain scan in psychosis?. Some current clinical utility To improve understanding of pathophysiology To refine (endo)phenotype definition ? (early) Diagnostic aids

E N D
PSYCHOSIS Neuro-Imaging(Schizophrenia and Bipolar disorder)What we know and what we could know Stephen Lawrie Edinburgh
Why brain scan in psychosis? • Some current clinical utility • To improve understanding of pathophysiology • To refine (endo)phenotype definition • ? (early) Diagnostic aids • ? Predicting treatment response and/or prognosis
Lesion detection – qualitative analyses of structural imaging • Lawrie et al, Schizo Res, 1997: • gross lesions (e.g. AVMs, cysts, tumours) in 0-5% • ‘atrophy’ in 4-52% c.f. 2-19% controls • HIS foci in 5-38% c.f. 3-19% controls • Usually of little clinical importance • i.e. CT/sMRI only indicated in atypical presentations • Albon et al, HTA, 2008: • In MRI studies, approximately 5% of patients had findings that would influence clinical management, whereas in the CT studies, approximately 0.5% of patients had these findings. • The strategy of neuroimaging for all psychosis is either cost-incurring or cost-saving (dependent upon whether MRI or CT is used) if the prevalence of organic causes is around 1%.
What did CT tell us? - Ventriculomegaly (corr. hospitalisation) and cerebral ‘atrophy’ (*Raz, Psychol Bull 1990, 108: 93-108) – VBR not bimodally distributed (Daniel, Biol Psych 1991, 30: 887-903) – VBR related to duration & Dx criteria (van Horn, Br J Psych 1992, 160: 687-97) – VBR not related to treatment response (Friedman, J Psychiatri Neurosci 1992, 17: 42-54) i.e. not much more than pneumo-encephalography
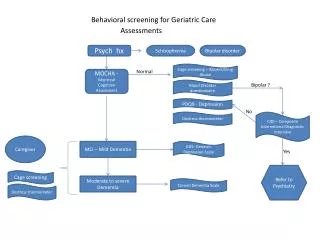
Segment images (GM, WM & CSF) & remove extra-cerebral voxels Normalise GM seg. to template to obtain norm. parameters Original T1 image Voxel Based Morphometry Smooth final images Segment normalised images & remove extra-cerebral voxels Apply norm. parameters to original images unmodulated modulated
sMRI systematic reviews in schizophrenia • reduced whole brain volume (by ~3% Ward, Schiz Res 1996;197-213) • corpus callosum similarly (Woodruff, JNNP 1995; 58: 457-61) • reduced hippocampal and amygdala volume (by about 4% each: Nelson, Arch Gen Psych 1998; 55: 433-40) • reduced pre-frontal & medial temporal lobe (MTL) volumes (Lawrie & Abukmeil, Br J Psych 1998;172: 110-120) • reduced superior temporal gyrus (STG) & increased globus pallidusvolumes (Wright, Am J Psych 2000; 157: 16-25) • reduced thalamus (Konick & Friedman, Biol Psych 2001; 49: 28-38) • reduced anterior cingulate (Baiano, Schizo Res 2007) • Similar changes also seen in first episode cases (Vita et al, 2005; Steen et al, 2006) • Also, 15 VBM studies consistently find reduced grey matter (GM) in MTL and STG (Honea et al, Am J Psych 2005; 162: 2233-45) • An ALE analysis of 27 articles found GM decreases in the thalamus, the left uncus/amygdala region, the insula bilaterally, and the anterior cingulate both first-episode schizophrenia (FES) and chronic schizophrenia. Comparing patient groups, decreases in GM were detected in FES in the caudate head bilaterally, while decreases were more widespread in cortical regions in chronic schizophrenia (Ellison-Wright et al, Am J Psych 2008).
Key unresolved questions • When and how do the abnormalities arise? • What is their neuropathology? • How is the anatomical phenotype related to the clinical and cognitive features? • Does it progress after onset? • Do antipsychotic drugs ameliorate or exacerbate these abnormalities?
Relatives have smaller MTLs than controls (Keshavan1997 & 2002; Lawrie 1999 & 2001; Schreiber 1999; Seidman1997 & 1999) Schizophrenics have smaller MTLs than relatives (Lawrie1999 & 2001;O'Driscoll2001;Steel2002 – but see Staal 2000) Best evidence for hippocampal differences on ROI(Waldo1994;Harris 2002;Seidman2002;van Erp2002 – but see Schulze2003). Best evidence for pre-frontal differences on VBM (Job 2003). Supported by twin studies (Suddath 1990; Baare 2001; Cannon/Narr 2002; van Erp 2004) …and g-e risk factor studies (DeLisi 1988; Stefanis 1999; McNeil 2000) Boos et al meta-analysis (Archives 2007) of relatives ROI finds hippocampal reductions in relatives Vs controls (ES 0.3) and additional difference in relatives Vs patients (ES 0.5) sMRI studies of relatives
Hippocampus volume is a best a weak and inconsistent predictor (Lawrie, Archives 2007): No prediction (Job, 2005; Johnstone, 2005; Velakoulis, 2006) Small hippocampus predicts (Pantelis 2003) Large hippocampus predicts (!) (Phillips 2002; Bogwardt 2007) Anterior cingulate and Superior temporal gyrus volumes may however predict (PACE studies) Gyral folding may predict (EHRS: Harris et al, 2007) Baseline prediction of conversion- studies of relatives or ‘ultra-high risk’
sMRI studies of pre-psychosis progression from the PACE clinic & the EHRS Pantelis et al (2003) reductions in grey matter in the left parahippocampal, fusiform, orbitofrontal and cerebellar cortices, and the cingulate gyri. Job et al (2005) reductions in grey matter in the left (para)hippocampal uncus and fusiform gyrus, and right cerebellar cortex
Magnetic Resonance Spectroscopy (MRS) • Initial resolution problems solved • Whole brain acquisitions still impractical • Incredibly consistent literature – reductions in frontal and temporal NAA which are not volume / medication artefacts (see Steen et al 2005 Neuropsychopharmacology 30 1949-62) • 3-4T systems give good enough resolution for reliable estimation of Glu, Gln, GABA; and α-ATP, β-ATP and γ-ATP moieties • Interpretation difficulties - ? a structural or functional index of integrity / viability
Diffusion Tensor Imaging (DTI) • Can assess the structural integrity of white matter tracts • Inconsistency of the literature in schizophrenia overplayed, but inconsistency of methods usefully highlighted, in a recent review (Kanaan et al 2005, Biol Psychiatry 58: 921-9) • ROI and VBM analysis giving way to TBSS and tractography analyses • Also, Magnetisation Transfer Imaging (MTI)
The future of structural imaging in schizophrenia • Increasingly sophisticated automated analyses – DBM and TBM • The anatomical basis of ‘disconnectivity’ e.g. GI, DTI • More high resolution studies e.g. 3T of CA3, ?Cx layers • The use of pattern classification methods to use more information to e.g. make diagnostic classifications • Automated extraction of regional volumes, to avoid brain averaging • Multi-centre studies • Integration with other techniques in ‘multi-modal imaging’
Electrophysiology EEG ERPs MEG NIRS LORETA rCBF studies SPE(C)T PET fMRI in conditions: Rest Active vs Rest Active Vs Active receptor ligands pharmacological manipulation Functional imaging techniques
Potential ‘confounders’ of functional imaging abnormalities • IQ • Reaction time • Distraction by positive symptoms • Motivation • Medication • Alcohol and other drugs • Structural brain abnormalities • Causative versus ‘effect modifying’ genes
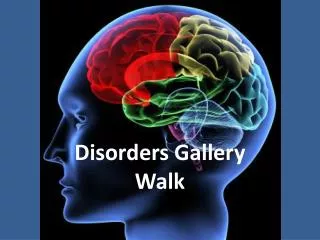
EHRS time-series images (n=200) blocked design Design matrix used in study (first level) Numbers on y axis represent images 1 -200. Columns 1-5 represent the four active conditions plus rest, 6-11 represent the realignment parameters realignment parameters entered into design matrix (columns 6-11) SMOOTHING with 6x6x6mm3 FWHM Gaussian kernal REALIGNMENT tofirst volume in series GENERAL LINEAR MODEL STATISTICAL INFERENCE NORMALISATION to SPM EPI template, linear affine and non-linear deformations SPM EPI template Individual subject activation map
Statistical maps of regionalcerebral blood flow • Conjunction analysis showing voxels with significantly (p < 0.01, voxel level) higher rCBF during the task than the control task. • Wisconsin Card Sorting Test stimuli. • (c) Voxels showing significantly (p < 0.05) higher rCBF in the task-minus-control contrast in the frontal lobes of controls as compared to patients.
Functional imaging (‘brain mapping’) systematic reviews Delayed and reduced P300 • Increased P300 peak latency (Ebmeier, Biol Psych 1991; 29: 1156-60) • Reduced P300 amplitude too (Jeon & Polich Psych Res 2001; 104: 61-74 & Psychophysiol 2003; 40: 684-701; also Bramon et al 2004 Sch Res 70: 315-29 PSES~0.6 & 0.8) ‘Hypo-’ and ‘Hyper-’ frontality • 21 resting PET studies ES –0.64 (95%CI –0.91 to –0.38) & 9 activated studies overall ES –1.13 (–1.53 to –0.73)(Zakzanis & Heinrichs, JINS 1999; 5: 556-66; see also Davidson & Heinrichs Psych Res 2003 122: 69-87 and Hill et al Acta Psychiatr Scand. 2004 110:243-56.) • Glahn et al (*Hum Brain Mapp 2005 25: 60-9) reviewed 12 N-back studies to find DLPFC ‘hypofrontality’ and ‘hyper-frontality’ in Ant. Cing. & (L) frontal pole ‘Hyper-’ and ‘Hypo-’ temporality • 13 SPECT studies show effect sizes from 0.25 (superior) to 2.0 (inferior); 6 PET studies show effect sizes from 0.14 (right) to 1.3 (superior) (Zakzanis, Psychol Med 2000; 30: 491-504) • Achim & Lepage(*Br J Psych 2005 187: 500-9)examined 18 episodic memory studies and found consistent (L) IPFC and (Bi) MTL reductions in activation
Prefrontal cortex dysfunction during working memory performance in schizophrenia: reconciling discrepant findings (Manoach Schizo Res,2003; 60: 285-298) • Schizophrenics show increased DLPFC activation in high load condition (five targets). • When task performance is matched by comparing schizophrenics in low load condition (two targets) to controls in high load condition (five targets), DLPFC activation does not differ. • If WM load was increased, one would expect relative hypofrontality in schizophrenia. • If the WM capacity of controls were exceeded, they might show reduced activation.
SPECT & PET dopamine - ligand studies Dopamine D2 receptor numbers are increased • effect size 1.47 in 17 PM & PET studies(Zakzanis, Schizo Res 1998; 32: 201-6) • by 12% in 13 imaging studies…(Laruelle, QJ Nucl Med 1998; 42: 211-21) • with moderate increases in both DA D2 density (Bmax) and affinity (Kd) (Kestler et al Behav Pharmacol 2001; 12: 355-71) Presynaptic dopaminergic function increased in striatum • …with greater amphet. DA releaseand DOPA decarb. activity (Laruelle, QJ Nucl Med 1998; 42: 211-21) • Striatal F-DOPA uptake and DOPA decarb. activity is increased in schizophrenia (e.g. Meyer-Lindenberg et al. 2002, replicates four previous reports)
Trends in functional imaging of schizophrenia • Testing the dis-connectivity hypothesis • Examining relatives and genetic / symptomatic high risk subjects • Genetic imaging • Computational modelling • Testing more specific hypotheses in activation studies e.g. fearful face processing, associative learning • ‘Default mode’ resting studies • ‘Biomarkers’ and other ‘Translational studies’
PET and/or fMRI replicated pre-frontal… functional disconnectivity • Less DLPFC reduction of (left) STG metabolism during verbal fluency on PET (Frith, 1995, Br J Psychiatry) and fMRI (Yurgulun-Todd et al, 1996) • Abnormal anterior cingulate dopaminergic modulation of STG activity on PET (*Dolan, Nature 1996 378:180-2; Fletcher, 1996 1998 & 1999) • Reduced (left) DLPFC-STG functional connectivity correlates with auditory hallucinations on fMRI (Lawrie, Biol Psychiatry 2002; Shergill, 2003) • Widespread disconectivities at rest and on activation including reduced fronto-temporal and fronto-parietal connectivities with both PET and fMRI (Meyer-Lindenburg, 2001 & 2005; Kim et al 2003; Foucher, 2005)
Other replicated disconnectivities 1. Reduced EEG coherence • Including reduced fronto-temporal coherence and hallucinations (Norman 1997; Ford 2002) 2. Effective connectivity on PET/fMRI: • Different AC-fronto-temporal interactions on PET (Jennings 1998) • Disease and medication related changes in Fronto-fronto/-parietal/-thalamo-cerebellar networks on fMRI (Schlosser, 2003 Schizo Res) • PET D2 binding path connections reduced in AC to frontal, parietal and thalamus regions with no Papez connectviity (Yasuno, 2005 PR:NI) 3. Increased ‘weirdness’ on fMRI (Welchew 2002) and signal variability on EEG (Winterer 2000) and MEG (Ioannides 2004) 4. Reduced (shortened) EEG ‘microstates’ (spontaneous concatenations) at rest (Koenig 1999; Lehmann 2005) 5. Abnormal gamma-band oscillation and synchronisation (Spencer 2003&4; Symond 2005) Overall, several EEG, PET and fMRI studies find disturbances in functional and effective connectivity within and from pre-frontal lobes (Stephan et al Biol Psych 2006)
Functional imaging in relatives ‘Hypo-’ & compensatory ‘Hyper-’ frontality • Berman (1992) – Sch twins hypofrontal on WCST • Blackwood (1999) – reduced L-IPFC & AC at rest • O’Driscoll (1999) – NS diffs in 17 relatives • Spence (2000) – NS diffs in 10 ‘obligates’ • Keshavan (2002) – reduced BOLD in DLPFC & IPC on MGS task • Callicott (2003) – (R)DLPFC increased BOLD on matched N-back task • Thermenos (2004) – increased BOLD in (L) DLPFC, AC, thalamus & PHG on CPT • Whalley (2004) – increased parietal & reduced front-thalamo-cerebellar BOLD on HSCT (etc) • Seidman (2005) - exaggerated fMRI response in DLPFC on auditory WM Disconnectivity Replicated reduced fronto-frontal connectivity on SPET (Spence, 2000) and fMRI (Whalley, 2005) Electrophysiology Bramon (2005) pooled 472 relatives & 513 controls: - P300 amplitude reduced (PSES 0.61, 0.30 to 0.91) - P300 latency delayed (PSES -0.50; -0.88 to -0.13) In a series of studies Winterer et al (2001, 2003, 2004) have internally replicated reduced EEG coherence and increased variance / reduced STN in relatives
fMRI in the Edinburgh High Risk Study- results with the Hayling sentence completion test • Reduced fronto-thalamo-cerebellar activation in all at genetic high risk & Increased parietal activation in those with psychotic symptoms (Whalley, Brain 2004) • Increased fronto-thalamo-cerebellar functional connectivity but no alteration in fronto-temporal connectivity (Whalley, Brain 2005) • Increased parietal, reduced lingual and reduced MTL/STG activation predicts onset of schizophrenia 1-15 months later (Whalley, Biol Psychiatry 2005) • Individuals homozygous for the risk allele (T/T) of the Neuregulin 1 (SNP8NRG243177) all developed psychotic symptoms, had reduced NART scores and decreased activation of right medial PFC and right posterior MTG (Hall et al Nature Neuroscience, 2006)
COMT Val > Met differences for parametric contrast High Risk subjects with the COMT Val allele also had reduced grey matter density in anterior cingulate cortex and a greater risk of becoming ill (McIntosh et al, Biological Psychiatry 2007; 61:1127-34). 19 MM 29 MV 9 VV
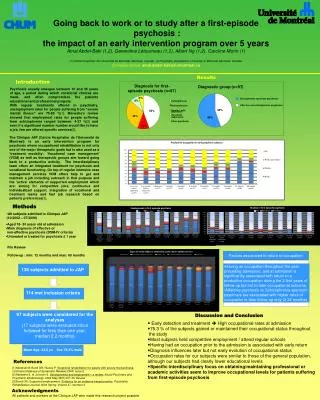
Delusions Disorganisation Hallucinations Negative symptoms Cyclical Depression Mania Disinhibition Elevated mood Mood disturbance Delusions Bipolar Disorder Schizophrenia No biological parameter defines either illness
Bipolar Disorder Schizophrenia Structure ↓ ventral PFC ↑ amygdala Structure ↓ thalamus ↓ HPC ↓ medial PFC Structure ↓ dorsal > ventral PFC ↓ amygdala / MTL Function ↓↑ dorsal PFC ↓↑ striatum ↓↑ amygdala Function ↑↓ ventral PFC ↑↓ ventral striatum ↑ amygdala Function ↓↑ Cingulate
Overall Conclusions • The gross structural neuroanatomy of schizophrenia…is evident to some extent in those at high risk and further MTL reductions are likely around onset…but it is at least partly non-specific and of largely unknown cause(s) WE NEED: #1 More longitudinal sMRI studies within 5 years of onset #2 Urgent harmonisation of multi-centre sMRI and approaches to DTI acquisition and analysis • The functional neuroanatomy of schizophrenia involves hypofrontality, and dopamine modulated striatal abnormalities and (symptom related) fronto-temporal disconnectivity WE NEED: #1 Functional imaging studies which examine performance at multiple points across the load-response curve, with and without pharmacological challenge #2 Harmonisation of approaches to functional and effective connectivity analyses, for EEG, MEG & fMRI, with a view to integration with DTI (and sMRI)