Download
1 / 6
60 likes | 306 Views
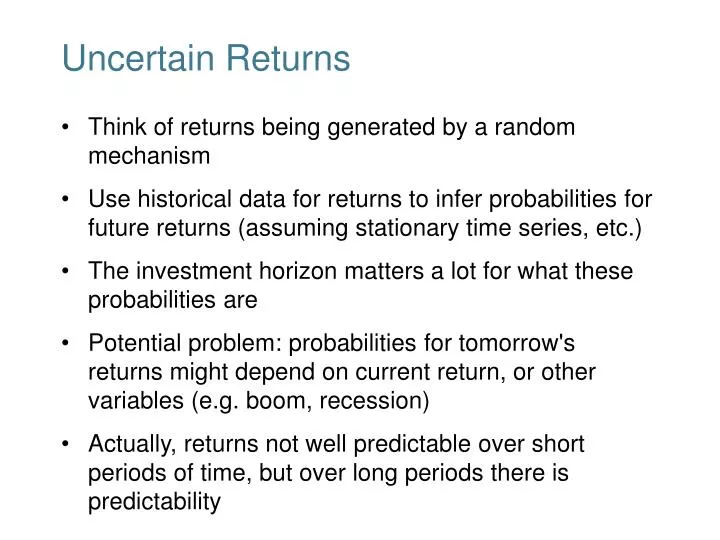
Uncertain Returns. Think of returns being generated by a random mechanism Use historical data for returns to infer probabilities for future returns (assuming stationary time series, etc.) The investment horizon matters a lot for what these probabilities are

E N D
Uncertain Returns • Think of returns being generated by a random mechanism • Use historical data for returns to infer probabilities for future returns (assuming stationary time series, etc.) • The investment horizon matters a lot for what these probabilities are • Potential problem: probabilities for tomorrow's returns might depend on current return, or other variables (e.g. boom, recession) • Actually, returns not well predictable over short periods of time, but over long periods there is predictability
Risk to Bondholders • Price fluctuations imply that bond is a risky asset • Long bond prices fluctuate if one-period interest rate changes (higher interest rate =>bond prices go down) • Real Return on a bond, with expected rate of inflation: • `ex post' (with realized inflation), Fisher equation true by definition • `ex ante' (with expected inflation), it is hard to test, because expected inflation is not observed • but: many countries have indexed bonds (TIPS), so real returns become observable • in countries with high inflation risk, firms often borrow in foreign currency
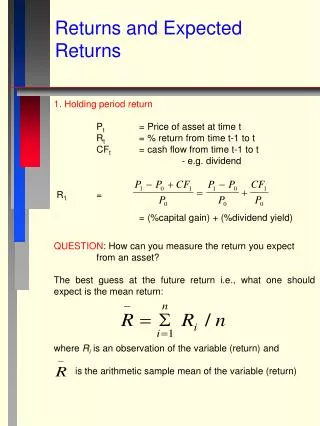
Probability Distributions • Suppose a random variable, such as a return R, can take N values, R1, R2, ..., RN, with probabilities π1, π2, ..., πN, respectively. • We summarize its behavior by • Mean E(R) = ∑N πn Rn • or E (R)= π1* R1+ π2* R2+…+ πN* RN • Measures of Risk • Variance var(R) = ∑N πn (Rn- E(R))2 • Standard Deviation σ(R) = √var(R)
Risk Return Tradeoff • Mean-standard-deviation diagram shows risk and expected return of possible portfolios • Every asset (or portfolio) can be represented by one point • Given a risky and a riskless asset, we can generate any portfolio on a straight line through the two assets • Points between the two assets correspond to positive portfolio weights. • Preferences determine the optimal mix of risky and riskless asset.
Several Risky Assets =>correlation between returns matter => we could get risk-free asset by creating a portfolio of 40% Pepsi and 60% Coke stocks
=> Diversification • Bottom Line: by holding several risky assets, risk can be reduced (diversification) • Expect to see people spreading wealth across many assets • How `good' an asset looks depends not only on own risk and return but also how it is correlated with other assets in the portfolio • For example, emerging markets are attractive because of low correlation with US index,