Download
1 / 11
110 likes | 314 Views
Comparison of Maximum Likelihood Estimate and Least-Squares Regression to Compute b -values for Three Different Tectonic Regimes. Christine Gammans. What is the b -value and why do we care?. Gutenberg-Richter Relationship: log 10 N = a - bM.

E N D
Comparison of Maximum Likelihood Estimate and Least-Squares Regression to Compute b-values for Three Different Tectonic Regimes Christine Gammans
What is the b-value and why do we care? Gutenberg-Richter Relationship: log10N= a - bM • Earthquake occurrence per magnitude follows a power law introduced by Ishimoto and Iida (1939) and Gutenberg and Richter (1944). • b-values are inversely proportionate to the differential stress on a system (Schorlemmer et al. 2005) • The global b-value is ~ 1 (Stein and Wysession, 2003) (Gammans and Newman, 2011)
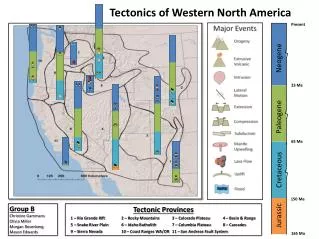
Tectonic Regimes • Eastern United States • Intraplate, few seismically active regions, notably New Madrid and Eastern Tennessee • Question as to the existence of any significant strain field • China • Seismically active, intraplate region • India’s collision with Asia produces significant strain and, therefore, earthquake activity • Chile • Subduction zone • Has produced two of the ten largest earthquakes on record (USGS).
Eastern United States Maximum Likelihood Estimate Least-Squares Regression b-value=0.9634 b-value=1.2477
Do they compare at 10,000 Bootstraps? Maximum Likelihood Estimate Mean b-value=0.9654 Standard Deviation=0.0405 Least-Squares Regression Mean b-value=1.2105 Standard Deviation=0.0923 Chi-Squared Test p-value=1.0233x10⁴ χ2=555.0214 Correlation Coefficient r=0.0003 p=0.9740
China Maximum Likelihood Estimate Least-Squares Regression b-value=0.9577 b-value=1.0658
Do they Compare at 10,000 Bootstraps? Maximum Likelihood Estimate Mean b-value=0.9577 Standard Deviation=0.0103 Least-Squares Regression Mean b-value=1.0715 Standard Deviation=0.0620 Chi-Squared Test p-value=1.0233x10⁴ χ2=150.3044 Correlation Coefficient r=0.0039 p=0.6987
Chile Maximum Likelihood Estimate Least-Squares Regression b-value=0.9769 b-value=0.8081
Do they Compare at 10,000 Bootstraps? Maximum Likelihood Estimate Mean b-value=0.8082 Standard Deviation=0.0067 Least-Squares Regression Mean b-value=0.9923 Standard Deviation=0.0810 Chi-Squared Test p-value=1.0233x10⁴ χ2=385.4640 Correlation Coefficient r=-0.0016 p=0.8724
Conclusions • The maximum likelihood estimate consistently gave the most consistent distribution across tectonic regimes and had the lowest error associated with the distribution • However, the least-squares method produced the more expected values for the Eastern United States (China and Chile are debatable) • The most appropriate method appears to vary by regime from this preliminary analysis, and, in the future, the results of each method should be analyzed before the method is finalized.
References • Gammans, C. N. and A. V. Newman (2011), Is the Relationship Between Modern Seismicity and Strain Fields Well Behaved in the Plate Interior?, Seismological Research Letters, 82, 327. • Gutenberg, B., and C. F. Richter (1944), Frequency of earthquakes in California, Bull. Seismol. Soc. Am., 34, 185–188. • Ishimoto, M., and K. Iida (1939), Observations of earthquakes registered with the microseismograph constructed recently, Bull. Earthquake Res. Inst. Univ. Tokyo, 17, 443– 478. • Schorlemmer, D., S. Wiemer, and M. Wyss (2005), Variation in earthquake size distribution across different stress regimes, Nature, 437, 539– 542, doi:10.1038/nature04094. • Stein, S., and M. Wysession (2003), An Introduction to Seismology, Earthquakes, and Earth Structure, Blackwell, Oxford, U. K. • United States Geological Survey (2010), Historic World Earthquakes, Retrieved April 27, 2011 from http://earthquake.usgs.gov/earthquakes/world/historical_mag.php