Download
1 / 17
180 likes | 397 Views
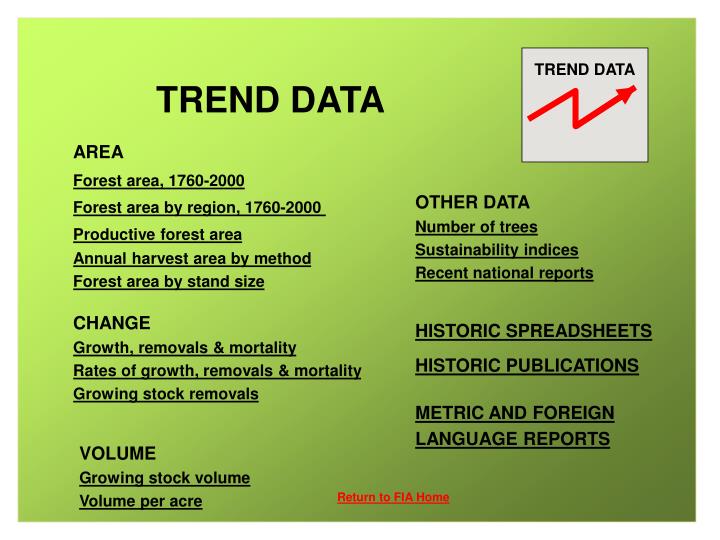
TREND DATA. TREND DATA . AREA Forest area, 1760-2000 Forest area by region, 1760-2000 Productive forest area Annual harvest area by method Forest area by stand size. OTHER DATA Number of trees Sustainability indices Recent national reports. CHANGE Growth, removals & mortality

E N D
TREND DATA TREND DATA AREA Forest area, 1760-2000 Forest area by region, 1760-2000 Productive forest area Annual harvest area by method Forest area by stand size OTHER DATA Number of trees Sustainability indices Recent national reports CHANGE Growth, removals & mortality Rates of growth, removals & mortality Growing stock removals HISTORIC SPREADSHEETS HISTORIC PUBLICATIONS METRIC AND FOREIGN LANGUAGE REPORTS VOLUME Growing stock volume Volume per acre Return to FIA Home
Return 1,100 Primarily 1,000 agricultural clearing in 900 the East 800 * 700 600 Million acres 500 400 300 200 100 - 1760 1800 1840 1880 1920 1960 2000 Forest area, 1760-2000 * Since 1900, forest area in the U.S. has remained statistically within 745 million acres +/-5% with the lowest point in 1920 of 735 million acres. U.S. forest area in 2000 was about 749 million acres. Basis for chart data: FIA Field Inventory Reports Forest Service report estimates prior to FIA field inventories. Based on Bureau of the Census land clearing statistics. Based on estimates of forest clearing proportional to population growth. Bars include area in all 50 current States. NEXT Source: National Report on Forest Resources and other historic data Return to FIA Home
Return Regional forest trends in the 48 States, 1760-2000 Original forests in what is now the U.S. totaled about 1.05 billion acres (including what is now the State of AK and HI). Clearing of forest land in the East between 1850 and 1900 averaged 13 square miles every day for 50 years; the most prolific period of forest clearing in U.S. history. This coincides with one of the most prolific periods of U.S. immigration. Currently, forests cover about 749 million acres of the U.S. or about 33 percent of all land. 400 350 300 South 250 Basis for chart data: Million acres 200 1940- pres. FIA Field Inventory Reports 1900 – 1930 Forest Service report estimates prior to FIA field inventories. 1850 – 1890 Based on Bureau of the Census land clearing statistics. 1760 – 1840 Based on estimates of forest clearing proportional to population growth. North Interior West 150 100 Pacific Coast 50 - 1760 1780 1800 1820 1840 1860 1880 1900 1920 1940 1960 1980 2000 NEXT Source: National Report on Forest Resources and other historic data Return to FIA Home
Return Area of productive unreserved forest by major owner group, 1953-2002 The area of productive unreserved forest land (timberland) has remained stable for the last 50 years. Source: National Report on Forest Resources NEXT Return to FIA Home
Return Average annual harvest area by region and method Source: FIA State Reports from the mid 1980s to mid 1990s. Harvesting affects nearly 10 million acres in the U.S. annually, or about 1.3% of all forest land. Over half the harvest area is in the South which provides nearly 60% of all the Nation’s forest products annually. While significant, harvesting affects less than 3% of the South’s forests annually. Only about 38 percent of the Nation’s annual harvest area is by the clearcut method. NEXT Return to FIA Home
Return WEST (excluding Alaska) NORTH 0.80 0.80 0.70 0.70 0.60 0.60 0.50 0.50 Proportion of forest Proportion of forest 0.40 0.40 0.30 0.30 0.20 0.20 0.10 0.10 - - 1953 1977 2002 1953 1977 2002 10+" stands 5-10" stands 1-5" stands Nonstocked 10+" stands 5-10" stands 1-5" stands Nonstocked SOUTH 0.80 0.70 0.60 0.50 Proportion of forest 0.40 0.30 0.20 0.10 - 1953 1977 2002 10+" stands 5-10" stands 1-5" stands Nonstocked Forest area by average stand diameter Source: Forest Resources of the United States, 2002 The optimal mix of forests of different average size trees is difficult to define and depends greatly on management objectives. Clearly, the effects of human activity and natural events paint different pictures in different regions. In the North, as forests mature, stands over 10-inches in average diameter have nearly doubled since 1953 while smaller diameter (younger) stands are declining as a proportion of all forests. In the South, as pressure increases on commercial harvesting, 1-5 inch average diameter stands, planted and natural, are increasing. In the West, as public harvesting has declined, larger diameter stands continue to increase and smaller diameter (younger) stands are declining. NEXT Return to FIA Home
Return 25 Growth 20 15 Removals Billion cubic feet 10 5 Mortality 0 1953 1963 1977 1987 1997 2002 Growing stock growth, removals, and mortality on productive unreserved forest, 1953-2002 Total volume of net growth has stabilized in recent years. Removals have stabilized but imports are on the rise. While total mortality is up, the rate of mortality as percent of live volume is stable. NEXT Source: National Report on Forest Resources Return to FIA Home
Return 3.5 3.0 Growth 2.5 2.0 Percent of total live volume Removals 1.5 1.0 0.5 Mortality 0.0 1953 1963 1977 1987 1997 2002 Rates of growing stock growth, removals, and mortality on productive unreserved forest, 1953-2002 As the nation’s forests continue to increase in average age and decline in trees per acre, the rate of net growth is declining. The removals rate has declined slightly but imports are on the rise. While total mortality is up, the rate of mortality as percent of live volume is relatively stable. NEXT Source: National Report on Forest Resources Return to FIA Home
Return Growing stock harvest by major owner, region and year 14 As public policy has shifted, removals have moved dramatically from public land in the West to private land in the East in the last 15 years. 12 Public 10 Private 8 Billion cubic feet 6 4 Click here for additional historic data on U.S. Timber Production, Trade, Consumption, and Price Statistics 1965-2002. 2 0 1996 2001 1952 1962 1976 1986 1996 2001 1962 1976 1986 1952 EAST WEST Source: National Report on Forest Resources Return to FIA Home NEXT
Return 600 500 Private 400 Billion cubic feet 300 Public 200 100 0 1953 1963 1977 1987 1997 2002 Growing stock volume on productive unreserved forest by major owner group, 1953-2002 As removals remain at levels below net growth, volume on productive unreserved forest land (timberland) continues to rise. NEXT Source: National Report on Forest Resources Return to FIA Home
Return 3000 2500 Public 2000 Cubic feet 1500 Private 1000 500 0 1953 1963 1977 1987 1997 2002 Volume of growing stock per acre on productive unreserved forest by major owner group, 1953-2002 Volume per acre on productive unreserved forest land (timberland) continues to accrue with the highest volumes per acre on public forest. NEXT Source: National Report on Forest Resources Return to FIA Home
Return Numbers of live trees by diameter, 1977 and 2002 As forests mature the average number of small trees tends to decline due to natural competition and the number of large trees increases. This pattern is evident in the U.S. over the past 25 years, although it may vary by region and historic conditions such as harvesting and catastrophic events such as fire. There are currently nearly 300 billion trees at least 1-inch in diameter in the U.S. Source: National Report on Forest Resources Return to FIA Home NEXT
Return 1.4 GS -Index 50 1.3 1.2 1.1 E-Line 1.0 F -Index 50 0.9 Index value 0.8 0.7 C-index 0.6 P-index 0.5 0.4 0.3 0.2 1974 1976 1978 1980 1982 1984 1986 1988 1990 1992 1994 1996 1998 1950 1952 1954 1956 1958 1960 1962 1964 1966 1968 1970 1972 U.S. forest production, consumption, growing stock and area sustainability indices Click here to go to: 2003 U.S. Sustainability Report The GS50-Index is the cumulative accrual factor for growing stock volume since the base year 1950. The E-Line is the equilibrium point where net annual growth would be equal to domestic production in a given year. If this occurs, the growing stock accrual line would flatten during that period. The F50-Index is the change in total forest area since the base year 1950. The P-Index is the proportion of annual net growth needed to provide for domestic timber production in a given year. The C-Index is the proportion of annual net growth that would be needed to provide for domestic consumption in a given year if there were no imports and we were required to meet our own demand. NEXT Source: National Report on Forest Resources and U.S. Timber Production, Trade, Consumption, and Price Statistics 1965-2002. Return to FIA Home
Return Most Recent National Reports & Brochure 2003 U.S. Sustainability Report Pdf Pdf version of Report Excel Report tables Pdf Brochure State of the Nation’s Ecosystems Pdf Return to FIA Home
TREND DATA HISTORIC SPREADSHEETS 1630-2000 US forest area and population 1977 RPA tables 1987 RPA tables 1997 RPA tables 2002 RPA tables 1953-2002 RPA regional summary statistics 1953-2002 Harvest area and volume 1977 and 2002 number of live trees 1963-2002 GS trees by species and dbh 1987-2002 NFS timberland summary 2001 IUCN Red List data for US trees Historic FIA Inventory Dates by State Return to FIA Home
TREND DATA HISTORICPUBLICATIONS Historic Data Bibliography 1885 US Forest Facts 1909 The Timber Supply of the United States 1910 Forest Resources of the World 1920 Capper Report 1932 US Forest Situation 1937 Lake States Survey Stories 1946 US Forest Status 1948 FIA Status Report 1960 Business of Counting Trees 1964 FIA Status Report Return to FIA Home
TREND DATA METRIC AND FOREIGNLANGUAGE REPORTS Metric Reports US Forest Trends 1953-1997 [Spanish] US Forest Trends 1953-1997 [French] US Forest Trends 1953-1997 [Russian] US Forest Trends 1953-1997 [Portuguese] US Forest Trends 1953-1997 [English] Forest Resources of the US, 1997 US Forest Trends 1953 – 2002 [English] SPREADSHEETS 1997 RPA tables [METRIC]2002_RPA tables [METRIC] Return to FIA Home