Download
1 / 31
310 likes | 435 Views
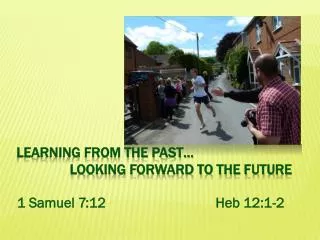
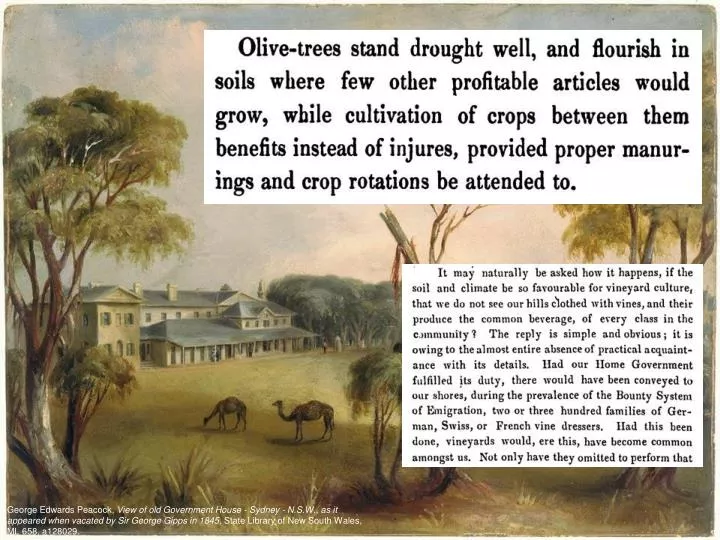
George Edwards Peacock, View of old Government House - Sydney - N.S.W., as it appeared when vacated by Sir George Gipps in 1845, State Library of New South Wales, ML 658, a128029. Learning from the past. Responses to drought in New South Wales were often ‘ band aid ’ solutions

E N D
George Edwards Peacock, View of old Government House - Sydney - N.S.W., as it appeared when vacated by Sir George Gipps in 1845, State Library of New South Wales, ML 658, a128029.
Learning from the past • Responses to drought in New South Wales were often ‘band aid’ solutions • Moving cattle and sheep, importing food from other colonies and overseas • Repeated periods of long-term drought forced settlers to question the sustainability of pastoral and agricultural practices • Ways of living in arid regions were seen as long-term solutions to the problems associated with periodic drought J. W. Lewin, The Plains, Bathurst, ca. 1815-1816, State Library of New South Wales, a128133
From drought to flooding rains… Source: Unknown artist, flood on the Hawkesbury River, June 1816, Sydney NSW. A rage for curiosity : visualising Australia 1788-1830, Richard Neville. Sydney : State Library of New South Wales Press, 1997.
Lesser known 19th century wet periods Brisbane Floods 1893, Source: State Library of Queensland
Above average rainfall 1870–1875 Anomalies calculated with respect to 1900–2009 average
A flood at Wagga Wagga, Illustrated Australian News, 18 June 1870.
RAIN (written during the Floods.) Rain, rain Nothing but rain! Sapping the upland, flooding the plain; Drowning our cattle, spoiling our grain-- Rain, rain-- Pitiless rain! Rain, rain-- Ne’er-ceasing rain! Oh, for the sun to cheer us again-- The gay blooming fields, and stout harvest wain-- Rain, rain-- Heart-breaking rain! Rain, rain-- Death-dealing rain! Youth, manhood, and age alike you have slain-- Stifled their wailings, embittered their pain-- Rain, rain-- Merciless rain! Rain, rain-- Wide-spreading rain! Oft times a blessing, sometimes a bane; All long for thy going, but longing's in vain-- Still rain-- Hope-crushing rain! Sydney Morning Herald, 23 May 1870 Charles Norton, Yarra River in Flood 1862, State Library of Victoria, H88.21/59
Samuel Calvert, Incident of the Late Flood, New South Wales, 1870, State Library of Victoria, IAN13/08/70/140 ‘Sir, The continued rains and floods remind us of the flood of forty days we read of in Genesis, when “God saw the wickedness of man was great in the earth.” If the wickedness of man then caused that once great flood which covered the whole earth, why should not our wickedness be the cause of the present-and recent floods. Think of our much unnecessary work on Sundays, our general extravagance, particularly in drink and ladies' dress, our propensities for money making, and our self-neglect. After our severe colonial droughts, only a few months back, suspending the necessary supplies in an alarming degree required for man and beast, God, in answer to private and special public prayers in our necessity, sent rain for the good of all animal and vegetable creation; and the fruits of the earth were in superabundance granted to us... Yet this very rare opportunity of setting apart a day for public thanksgiving near the close of our harvests was overlooked. Oh! the sin of ingratitude! ... if we obtain a public fast-day, general or limited, and humble ourselves, the continued rains will probably cease, and temporal and spiritual prosperity will yet be gained, and that speedily.’ Sydney Morning Herald, 26 May 1870
Maitland (Hunter Valley) in flood, 1872. SLV Image H2010.134/85.
Floods at Sandhurst (Bendigo), 1873?, wood engraving, nla.pic-an10319478.
Map of Goyder’s Line, History South Australia, http://www.history.sa.gov.au/chu/programs/sa_history/sa_dry/map_goyders.htm
Image: National Library of New Zealand • South Australia 1866 - 1876 • Area under wheat grew 166,200 ha to 363,700 ha • Wheat production rose from 97,600 tonnes to 292,000 tonnes
What about the natural world? Tree growth rings Biological and geological indicators capture natural climate variability on seasonal–centennial timescales e.g. tree rings, corals, ice cores, lake sediments, cave records. Science known as ‘palaeoclimatology’ SEARCH used ‘high resolution’ i.e. monthly–annually resolved palaeoclimate records to extend the instrumental climate record centuries into the past • Provides estimates of pre-industrial or ‘natural’ climatic variations to assess recent climate extremes • Palaeoclimate reconstructions are a tool for comparison with climate models: • Assess the role of ‘natural forcing’ e.g. solar, volcanic, internal ocean–atmospheric processes (ENSO, SAM, IOD) and anthropogenic greenhouse gas forcing Ice laminations Coral banding
Tree rings Sources: NOAA WDC for Palaeoclimatology, Matthew Brookhouse (ANU), Andrew Lorrey (NIWA)
Corals Sources: NOAA WDC for Palaeoclimatology, Australian Institute for Marine Studies (AMIS), Braddock Linsley (Columbia University)
Ice cores Sources: NOAA WDC for Palaeoclimatology, Australian Antarctic Division
Speleothems (cave deposits) Sources: Janece McDonalad (University of Newcastle) Russell Drysdale (University of Melbourne)
South-eastern Australian rainfall reconstruction • ‘Proof of concept’ study using 12 well-dated, annually resolved records from Australasia with published climate sensitivity (largely ENSO) to assess the feasibility of developing an initial rainfall reconstruction for SE Australia • Locations sensitive to large-scale climate modes associated with the Pacific, Indian and Southern Ocean variability Corals Trees Ice cores Gergis et al. (2012), Climatic Change
Capturing large-scale, coherent rainfall variations: (i) instrumental and (ii) palaeoclimate data Instrumentalobservations Palaeocliamte records • Grid points where a statistically significant proportion of the variations in May–April Australian rainfall can be represented by 12-station observational network (left) and first 3 leading modes of common variability (Principal Components) of the palaeoclimate network (right) • - Palaeo network is able to capture the common signal seen in the instrumental observations Gergis et al. (2012), Climatic Change
SE Australian rainfall variability: 1783 –2009 Gergis et al. (2012), Climatic Change Wettest period in instrumental record (1950s and 1970s) ? Driest period in instrumental record (late 1990s/early 2000s) Rapid changes from wet to dry (and dry to wet) evident through record • Innovative statistical techniques used to generate an ensemble of 10,000 reconstructions – collaboration with statisticians and meteorologists, robust uncertainty estimates (grey envelope) • ‘Best estimate’ reconstruction (black line) - 12 records capture 72% of the observed rainfall variations in SEA (r = 0.85), distinct decadal scale wet and dry phases • Wet and dry cycles seen in the pre-industrial period (natural variability), since the 1970s there have been fewer very wet years (human-caused temperature increases?) Median of 10,000 member ensemble of rainfall reconstruction Observed area-averaged rainfall from AWAP rainfall grid (1900–2009) Observed area-averaged rainfall from nine high-quality stations (1873–2006) Gergis et al. (2012), Climatic Change
How does the ‘Big Dry’ compare to rainfall estimations reconstructed since 1783? • According to our rainfall reconstruction ensemble, there is a 97% chance that the 1998–2008 decadal rainfall deficit was the lowest since first European settlement of Australia 2.9% Gergis et al. (2012), Climatic Change
PAGES regional 2K network • Global effort to consolidate regional palaeoclimate data that covers the last 2000 years • Aim of the initiative is to produce high-resolution, proxy-based climate reconstructions for comparison with high resolution Earth System Models: 1) temperature reconstructions for IPCC AR5 release in 2013, 2) PAGES 2K synthesis book (all variables) by 2014 • ‘Aus2K’ Australasian component: important area of southern mid-latitudes: El Nino–Southern Oscillation (ENSO), Southern Annual Mode (SAM), Indian Ocean Dipole (IOD) Source: http://www.pages-igbp.org/workinggroups/2k-network
Availability of palaeoclimate data in the Australian region IPCC AR4 (2007) Only 5 high resolution records available for the Australasian region for the last IPCC report Neukom and Gergis recently compiled and reviewed 174 high-resolution records from the Southern Hemisphere to improve data availability for climate analysis (doubling of IPCC AR4 SH palaeo network) Now over 50 sites from Australasia available for palaeoclimate reconstruction Neukom and Gergis (2012), The Holocene
Australasian temperatures of past 1000 years • 1000 year Australasian spring–summer (SONDJF) mean temperature anomalies (land and ocean): mean of 3000-member ensemble based on varying reconstruction parameters (28 records) • 96.5% of our reconstruction ensemble members indicate that there are no other warm periods in the past millennium that match or exceed post-1950 warming observed in Australasia • Three warmest decade of the past 1000 years occur consecutively in the 1980s, 1990s and 2000s • Model comparison show that atmospheric–ocean circulation and anthropogenic greenhouse gases have more influence on reconstructed Australasian temperatures than solar and volcanic variations: increased greenhouse gas concentrations since 1950 are now swamping the influence of ‘natural’ variability in our region Gergis et al. (2011), Journal of Climate, in revision.
Climate change: Greenhouse gases Concentrations in 2010 CO2 = 390 ppm, CO2-e = 470 ppm From CSIRO/BoM (2012)
Climate change: Global temperature Anomalies with respect to 1961-90 average From WMO, 2012
from “State of the Climate 2009”, Bull Am Met Soc, 2010 Indicators of global warming
Future climate change • - Continued emissions of greenhouse gases will lead to substantial further warming, about 5C above historical levels • Rapid and substantial reductions in emissions are needed to minimise dangerous climate change • - Projected changes in SE Australia include more hot extremes, reduced rainfall in winter, and continued variability, with droughts and floods Fig 5.1, The Science of Climate Change, AAS 2010
What have we learned? South eastern Australia has a naturally variable climate but is starting to experience some rainfall and temperature extremes that are highly unusual in a long term context An incredible amount of climate information lies within historical sources: provide a fascinating insight into how past Australian societies have been influenced by climate variability and extremes over time Knowledge of past climate variability is critical for improving estimates of the range of natural climate variability and how future climate change will influence Australian prosperity in an increasingly warm world Sometimes the best way forward is through the past… Source: National Gallery of Victoria
Help write Australia’s climate history www.climatehistory.com.au