Download
1 / 7
150 likes | 612 Views
Study each population pyramid & answer the questions below for each graph: Describe and give reasons for the population pyramid (4 marks) Study the population pyramid shown and say which stage it is in - in the Demographic Transition Model - give reasons for your answer (3 marks).

E N D
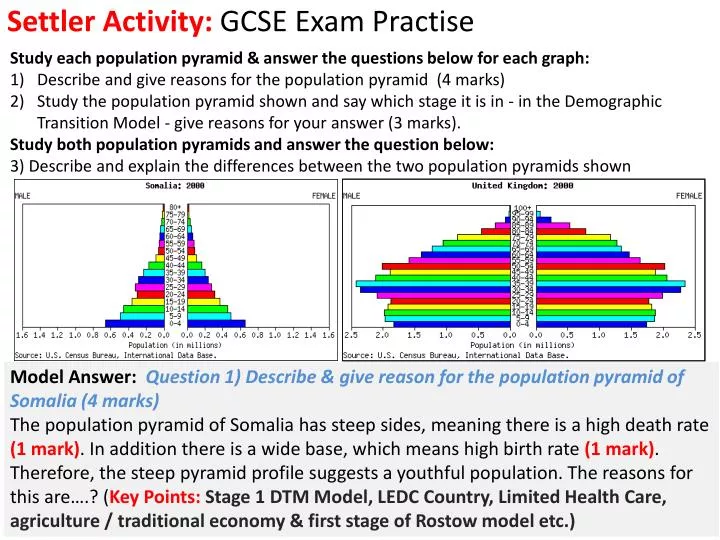
Study each population pyramid & answer the questions below for each graph: Describe and give reasons for the population pyramid (4 marks) Study the population pyramid shown and say which stage it is in - in the Demographic Transition Model - give reasons for your answer (3 marks). Study both population pyramids and answer the question below: 3) Describe and explain the differences between the two population pyramids shown Settler Activity: GCSE Exam Practise Model Answer: Question 1) Describe & give reason for the population pyramid of Somalia (4 marks) The population pyramid of Somalia has steep sides, meaning there is a high death rate (1 mark). In addition there is a wide base, which means high birth rate (1 mark). Therefore, the steep pyramid profile suggests a youthful population. The reasons for this are….? (Key Points: Stage 1 DTM Model, LEDC Country, Limited Health Care, agriculture / traditional economy & first stage of Rostow model etc.)
Settler Activity: Helpful Worksheet • Main features: • Narrow base with many women having less than two children • Women are marrying later • Contraception is universal in countries such as Britain • Excellent medical care and high standards of living mean the infant death rate is low - most children live to middle and old age • Death rates are low and are only high in extreme old age which gives the pyramid its straight sides • On average women can expect to live to 83 years and men to 76 years • High number of elderly dependents with more females than men • Main Features: • The wide base indicates a high proportion of children • Large families reflect the low status of women, early marriages, lack of education and little family planning available • The steep sides show that the death rate is high for both the young and adults • Life expectancy is also low with few people reaching old age • High death rates reflect the lack of medication, clean water and regular food supplies • Populations are growing rapidly and in the case of Somalia are expected to double in 25 years
The Rostow model is… We are learning about the Rostow model because… The 5 main stages of the model are… • Learning Outcomes: • To describe the main features of the Rostow model of development and relate this to the changes in population structure for a given country. • To identify how the birth and death rate of a country changes as a country becomes more wealthy.
1) Study each population pyramid & answer the questions below for each graph: • Describe and give reasons for the population pyramid (4 marks) • 2x1 mark available for describing the population pyramid e.g. a wide base for a high birth rate. • 2x1 mark available for giving reasons for the shape of pyramid e.g. high birth rate reflect lack of contraception and birth control. • Study the population pyramid shown and say which stage it is in - in the Demographic Transition Model - give reasons for your answer (3 marks). • Study both population pyramids and answer the question below: • 3) Describe and explain the differences between the two population pyramids shown
Traditional Subsistence Economy • Agricultural • Little Manufacturing of goods. • Few external links to other countries • Low levels of population growth • High birth and death rate • Most people live in villages Preconditions for take-off • External links other countries developed • Resources increasingly exploited by developed countries. • Countries begin to develop urban system (simplecities) • Most of the population live simple housing. A small parentage become more wealthy. • Population increases
Take-off to maturity • Economy expands rapidly – especially manufacturing goods • Population attracted to urban areas for jobs • Cities grow rapidly in size • Country become more organised e.g. health, transport, water etc. • Drive to maturity (Sustained growth) • Diversification of the economy • Development of the service industry • Growth spreads to other regions & sectors • Population growth slows/stabilises • E.g. Greece. • Age of mass-consumption • Advanced urban-industrial systems • High production & consumption of consumer goods • Population growth slows considerable