Download
1 / 17
170 likes | 296 Views
Markus Amann International Institute for Applied Systems Analysis (IIASA). GDP. After 1990 Asian emissions have grown rapidly due to fast economic development. SO 2. NO x. Per-capita NO x emissions 1940-2030. Per-capita NO x emissions 1940-2030.

E N D
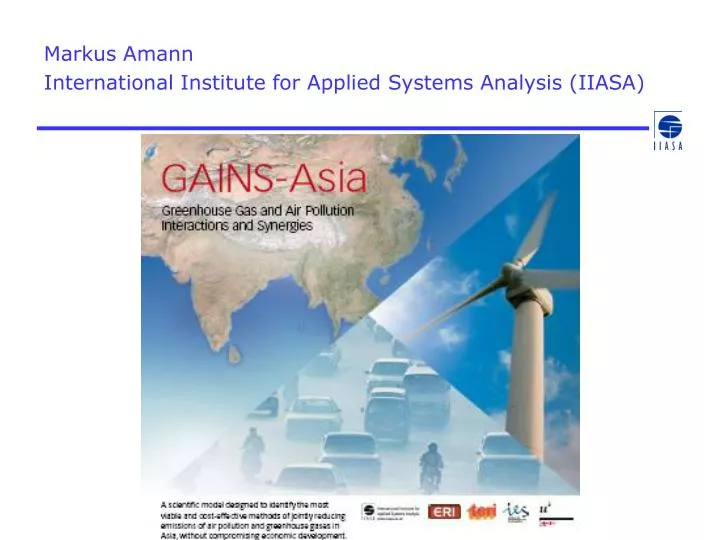
Markus Amann International Institute for Applied Systems Analysis (IIASA)
GDP After 1990 Asian emissions have grown rapidlydue to fast economic development SO2 NOx
Air pollution causes severe health impactsIndia, 2000 (Source: GAINS-India) Loss in statistical life expectancy from exposure to outdoor PM2.5 DALYs from air pollution
CO2 2000 = 100% The economic projection of the Indian government provided by TERI
2000 = 100% Air pollution will grow toodespite the current Indian pollution control legislation SO2 NOx PM2.5
Health impacts from PM2.5 in 2030for governmental energy projection + current AQ legislation Loss in statistical life expectancy from exposure to outdoor PM2.5 DALYs from air pollution
CO2/capita Total CO2 emissions GDP/capita CO2 emissionsBaseline projections with current measures, 2000 and 2030
Combined AQ and CC measures:1) Phase-out of solid fuels in domestic sector DALYs from air pollution CO2 emissions
Combined AQ and CC measures:2) End-of-pipe measures Emissions from electricity generation in Andra Pradesh Level in 2000
Costs of electricity generation Andra Pradesh, 2030 (Source: GAINS-India)
Combined AQ and CC measures:3) Sustainable energy systems Loss in statistical life expectancy from PM2.5 in 2020 (with current legislation on air pollution controls) Governmental energy baseline Alternative sustainability energy path Governmental energy baseline Differences: 1 million ton less CO2 emissions/year in 2020 7 billion $/yr less control costs for air pollution 8 months life expectancy or 10 million life years gained per year
Costs of CO2 reductions for China in 2020and associated changes in air pollutants emissions
Conclusions • In addition to “conventional” air pollution problems from industrial sources, AQ impacts from poverty add an additional burden in developing countries. • Interactions between air pollution and GHG mitigation are equally relevant for developing countries. Well-selected measures to improve local air quality in the near term can deliver co-benefits on GHG emissions.
GAINS-Asia is freely accessible at the Internetwww.iiasa.ac.at/web-apps/apd/gains/AS/index.login