Download
1 / 45
450 likes | 575 Views
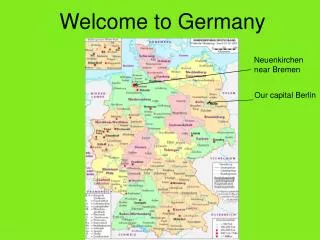
Moving to a Low CO2-Future on a Local Level The Experiences of the City of Hannover [Germany]. Hannover: A Liveable City at the Heart of Europe Pop: 520,000 inhabitants (Region:1.1 Mil.). City of Hannover. 520,000 inhabitants; 204 km ² Capital and economic centre of Lower Saxony

E N D
Moving to aLow CO2-Future on a Local LevelThe Experiences of theCity of Hannover [Germany]
Hannover:A Liveable City at the Heart of EuropePop: 520,000 inhabitants(Region:1.1 Mil.)
City of Hannover • 520,000 inhabitants; 204 km ² • Capital and economic centre of Lower Saxony • the world’s largest trade fair location • 35.000 students in famous universities • 245.000 jobs in service industries (e.g. insurances) and manufacturing and processing industries (e.g. automobile)
Hans Mönninghoff • since 1989 Head of the City of Hannover Directorate of Environmental Affairs • since 1997 also Deputy to the Lord Mayor in his function as Chief Executive • since 2005 also Head of Directorate of Economic Affairs • until 2013 re-elected in all three functions 1,800 employees; 370 Mil. Euro budget p.a.
Lord Mayor (directly elected every 8 years) also Chief Executive and a member of the City Council City Council (64 Councillors), elected every 5 years Three Mayors from the three main political parties, with purely ceremonial functions • 5 Directors of Services, appointed for • 8-year terms by the City Council • Heads of Directorates of: • Finance, legal services, civil registration and public order • Health, youth and social services • Arts and education • Economic and environmental affairs • City planning and civil engineering Hans Mönninghoff Deputy Chief Executive Director of Economic and Environmental Affairs One of these 5 Directors is Deputy to the Lord Mayor in his Chief Executive function Since 21 years, Hannover has a coalition between the social democratic party and the green party with a strong engagment in local sustainability The political Structure of the City of Hannover
Why do we speak about low carbon strategies? CO2 emissions in t per capita today: The energy consumption in the developing countries will rise!The necessity is clear:In order to limit global warming to 2°C, industrial countries have to drastically reduce CO2 emissions by 2050 to 2 t per capita.Otherwise we will be confronted with a climate catastrophe.
G20 low carbon competitiveness Report of the Climate Institute (Sep. 2009) Australia is ranked 15th out of 19 industrial countries and is the lowest of the Annex I countries of the Kyoto Protocol The GDP per tonne of CO2 is very different in the countries Australia0,8 Germany2,0 Japan 3,6
Hannover as a interesting local case study for low carbon strategies Hannover is aninteresting example ofhow much, withinexisting frameworksand conditions, can be achieved by a local authority.
Hannover‘s clear advantages: • Political - stable socialist/green party majority on the City Council, setting environmental priorities since 1988 • Committed climate protection unit in the city administration • Energy Initiative - majority municipal holding in the city energy utility, ‘enercity’ • enercity generates enough electricity to cover Hannover’s entire consumption without nuclear power.
Ambitious Targets set by City Council Resolutions: • 1992: First Climate Protection Programme, aiming for a 25% cut in CO2 emissions, 1990-2020 • 2008: a New Target – 40% Reduction from 1990 to 2020
Hannover has powerful instruments: • a climate protection fund, awarding grants totalling 5 million € each year for the last 10 years • a regional climate protection agency involving around 60 institutions and companies • a professionally-led Agenda 21 process with the broad-based support and involvement of local people • an excellent local public transport network
Some more information to the ‘proKlima’ Fund,5 million € per year in subsidies for:feed of:- 2 Mio. € additional charge on gas- sale of the utility- 2 Mio. € from the utility-profit- 1 Mio. € from the municipality • house insulation • construction of Low Energy Houses • high-efficiency heating systems e.g. decentral CHP plants • extension of the district heating network • electricity saving campaigns • renewable energy use
Hannover has considerable practical experience: • 3,000 Low Energy Housing (LEH) at Kronsberg, a Greenfields Settlement • about 300 Passive Houses • Current Project, ‘Concerto’, applying LEH standards to retrofitting older buildings • about 80 Industrial and Commercial Companies participating in the ‘Ecoprofit’ project.
Where do CO2 Emissions come from? about 50% from electricity generation about 33% from thermal energy production (space heating, hot water, process heat) about 17% from transport
Results so far: 1990 – 2005? Despite Positive economic growth; A growing population (+15,000); and More electricity use in private households (+32%!) Greenhouse Gas Emissions declined by about 7.5% between 1990 and 2005!
*including upstream emissions e.g., from gas extraction in Russia
Compared to other European cities, a 7.5% reduction from 1990 – 2005 is excellent. The challenge is, however, to achieve reductions of 40% over the period 1990 – 2020. Therefore the municipality, the city energy utility and around 80 civic society stakeholders worked together from September 2007 till June 2008 on a climate protection programme for the years 2008-2020 The motto: ‘Hannover Climate Alliance 2020’
What are the Successes?What are the Challenges?Where do we go to reach 40% in 2020?Seven Thematic Areas1. Electricity generation2. Private households3. Industry4. Muncipal building management5. Waste management6. Transport7. Renewables
Efficient Electricity Generationhas achieved so far: • 30% of electricity generated from gas and coal-fired plants comes from cogeneration (CHP) plants. (national average: 12 %) • 21% increase in district heating delivery by 2005 • 91 additional decentralised CHPs: capacity 7.6 MW
1. Efficient Electricity Generation the next stages: Voluntary commitment by the local utility to reduce the CO2 factor for electricity generation from 950g/Kw in 1990 to 730g/Kw in 2020 without using nuclear power; Components of the enercity strategy: • expand CHP capacity by 600 GWh • modernise coal-fired power stations • construct highly efficient gas turbine generators • commit to and expand renewable energy sources • energy contracting service for customers.
2. City AdministrationMunicipal Buildings Management achieved: • Between 1997 and 2005, investment and staff training reduced heating energy consumption in municipal buildings by 24%. way to go: • ongoing conversion to district heating and decentralised CHP • All new buildings to be built meeting Passive-House-Standard • ongoing staff training and programmes with children in schools and kindergartens (saving today 0.5 Mil. € per year) • optimal energy-efficiency retrofitting in low-energy-standard
Retrofitting municipal buildings Hannover renovation programme, 2008-2011 250 m € investment volume 27 schools, 2 sports halls, 13 children’s day centres Ecological standards: 30% better than the newest legal standardPassive House components 22 Elisabeth Kirscht 21.10.2014
Two school–retrofitting-excambles saving:75% saving:61% saving:75% saving:61% 23 Elisabeth Kirscht 21.10.2014
2. City AdministrationFurther Possible Interventions by the Municipality • optimisation of energy efficiency in zoning plans • preferential sales of land to builders of Passive Houses • higher standards set for commercial areas e.g., priority for CHP, if the municipality can exert influence through clauses in land sale or planning permission contracts • energy efficiency the most important criteria for municipal procurement decisions • conversion of street lighting and traffic signals to low-energy lamps
3. Waste Management as part of CO2-reduction strategyDramatic reductions in waste quantities (1989 - 2002) • Waste avoidance (- 380,000 t) • Dumping of soil, building rubble, sewage sludge (- 340,000 t) • Recycling, composting of organic waste (+ 72,000 t) • Recycling of glass, paper, packaging and scrap metal (+ 41,700 t) Decrease in waste-to-disposal from c. 1,000,000 to 200,000 tonnes p.a. in the City of HannoverIn 2005 we stopped sending waste to landfill
The Regional Waste Treatment Centre since 2005The Waste Managment System is nearly optimised incinerator mechanical sorting and composting facility fermentation composting from the fermentation plant
4. Private Households achieved: • Calculated on the 1990 housing stock, there was a reduction in heating demand of around 13%. • But with 15,000 more inhabitants and more living space per person the total area rose by 10%. • Therefore, the actual reduction in heating demand was only about 4%. • Private households are consuming 32% more power. There are more one-person households, and more computers and electrical appliances, many of them with stand-by wastage. way to go: • voluntary commitment by all housing companies to a 25% reduction in energy consumption by 2020 • intensive advice programme for inhabitants, especially those on low incomes (socio-political aspects!) • target: an overall reduction of at least 20%, 1990-2020
Energy-Optimized New Houses in Hannover from Low-Energy Houses (60 % less than normal new houses 3,000 units built in 1998/1999) via Lowest Energy Houses (15 KWh/sqm for Heating) to Climate Protection Estate 350 units with Zero Emissions: To start in 2010. From Kronsbergstandard via Passive houses To a Zero emission estate
Bricks Domestic electricity Heat Covering whole area Passive houses(15 kWh/m²a) + Quality assurance Renewable energies / CHP Electricity saving info. EndenergiekWh/m² Residual compensation by a small Hydro Power Station nearby Zero Emission Settlement “In der Rehre” 100 % CO2 Reduction
Passive-House-Standard by Retrofitting Before modernisation Built 1910 • Huge CO2-Saving ! • Sustainably retrofitted, keeping maintenance costs low • Long-term rentable condition ensured • Passive House components increase living comfort while markedly reducing energy demands. After modernisation
EU-Model-Project Concerto; 58 buildings with 310 apartements (28 buildings completed) 2006 /2007 206 dwellings (12,049 m²) Centralised heating system, connection to district heating network Support and advice for tenants Electricity saving advice for all tenants Training programme for planners
92% Energy saving result in the completed Concerto-buildings ! Actualsavings 92 % 33 Elisabeth Kirscht 21.10.2014
5. Industry achieved: • savings on heating 1990-2005 of about 16% • Electricity demand, driven by economic growth, rose by about 12%. way to go: • intensive energy efficiency advice campaign • voluntary commitments by major commercial/industrial energy consumers • A successful project: Ökoprofit
6. Transport Hannover has a successful Long-Term Transport Plan with a good Modal Split • 27% on foot • 13% by bicycle (530 km of separate cycle- lanes) • 41% by car - today no increase in cars/ household beyond 1995 levels (411 per 1,000 inhabitants) • 17% by public transport
Local Public Transport • very good Light Rail/U-Bahn network with 12 routes • 63 Bus routes • 933 km of Public Transport routes in the city • 163 million Passengers per year in the region (+10% in the last 5 years) • 160 Mil. € subsidies per year • good connections with the train network
Transport: What more is there to do on local level • In Hannover there is only few more things to do on the local level (more bicycle-lanes, etc.) • The main successes needed, are at the national level: - Cars with less energy consumption - Higher prices for fuel
7. Renewable Energy achieved so far: • Around Hannover, 240 wind turbine generators meet about 8% of the region’s electricity demand (450 GWh/a). • hydroelectric potential almost fully exploited at 16 GWh/a; the last one with 3 GWh/a is in planning
Solar energy in Hannover In the Hannover Region (1.1 Mio. inhabitants) 32.000 m² Solar heating (3.400 Units) 13.000 kWp Solar current (1.500 Units; approx. 120,000m²) This covers the electricity requirement of approx. 3.500 households A focal highlight in the skyline right from the main station: a photovoltaic installation on a Socio-cultural centre
7. Renewable EnergyTarget: to meet 30% of Hannover region’s electricity demand from renewable sources in the region. Positive: very good feed-in-prices for renewable energy to achieve this: • replacement of 100 existing wind turbines with larger models (re-powering) • construction of another 60 big wind turbines • 10% of arable land planted with fuel crops • big increase in photovoltaic-plants
Last but not least:More jobs by low carbon strategies Regional craft industries: • Investment in and technologies for climate protection stimulate a dynamic added-value chain for the regional craft trades and businesses - an important job motor for the local economy . • In the Hannover region there are already 3,000 people working in climate protection.
‘Hannover Climate Alliance 2020’ overview - CO2 reduction in tonnes p.a. 4,640,000 total emissions in 1990 = 9.2 tonnes per resident* 700,000 supply-side reductions through Stadtwerke Hannover (enercity) energy utility measures 700,000 20% demand-side reductions by industry, business and private households 400,000 electricity from renewable fuels in the region 40,000 energy-efficient municipal buildings 1,840,000 total reductions by 2020 = 40% below 1990 baseline = 6,4 tonnes per resident * not including traffic and not including upstream emissions e.g., from gas extraction in Russia
To summarise: • Hannover examples show that, with enough effort, it will be possible to reduce CO2 emissions in our cities by 40% (on a 1990 baseline) through to the year 2020. • BUT this cannot be achieved by municipalities and energy consumers alone. The crucial factors are: a) energy producers with local affiliations, creating decentralised cogeneration structures (CHP) b) significant subsidies for renewable energy sources, especially wind and biogas c) high fuel prices. 3. Transport is not included in this 40% reduction scenario, because a municipality’s scope for intervention is very limited – we need much more radical national and EU directives! There’s lots to do – so let’s get on with it!
Thank you! further information: www.sustainable-hannover.de www.hans-moenninghoff.de