Download
1 / 51
510 likes | 517 Views
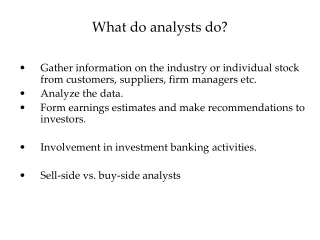
This study examines how analysts process information in financial statements using an eye-tracking experiment. It explores the relevance of non-GAAP measures and the differences between investors and creditors. The study also discusses current regulations and the IASB's project on primary financial statements.

E N D
How do analysts read financial statements? Preliminary results from an eye-tracking experiment DFG-Project Performance Reporting Maik Lachmann (TU Berlin), Ulrike Stefani (Konstanz), ArntWöhrmann (Gießen)
Motivation • Relevance of Non-GAAP measures • Analysts seem to regard EBIT / operating profit as comparatively useful(interview conducted by the IASB) • Brouwer, PWC(2007): Review of 2800 financial statements (1300 from 2005 and 1500 from 2004) from companies in the UK, France, and Germany • The number of line items on the face of the income statement varies between 8 and 48 (IFRS require only 6 line items) • The number of performance measures varies between 2 and 8 (IFRS only require the separate presentation of net profit or loss) • 96% of the companies report operating profit or EBIT on the face of the income statement, but companies use different definitions of these measures • Some national regulators prohibit / discourage the presentation of Non-GAAP measuresin financial statements (e.g., US, Netherlands, UK); others recommend reporting of Non-GAAP measures (e.g., France) How do analysts read financial statements?
Motivation What kind of information do external addresses regard as decision-useful?Are there differences between investors and creditors? • Current regulation on the presentation of Non-GAAP measures • As part of its plan to promote Better Communication in Financial Reporting, the IASB started the project Primary Financial Statements (June 2014) • Objective: Examining the content and structure of the primary financial statements, in particular of the statement(s) of financial performance • The IASB explores, among others, • requiring an earnings before interest and income tax (EBIT) subtotal(EBIT and EBITDA are non-IFRS financial measures) • providing guidance on the presentation of management performance measures • better ways of communicating other comprehensive income • reviewing required minimum line itemsin primary financial statements • considering the development of templates for primary financial statements • IFRS Taxonomy • Conceptual Framework for Financial Reporting, effective for annual reporting periods beginning on or after 1 January 2020 How do analysts read financial statements?
Motivation • How do addressees process information contained in financial statements? • Presentation format matters! • Maines & McDaniel (2000): More complete and more transparent reporting formats increase non-professional’s information acquisition and use • Frederickson & Miller (2004): Analysts and non-professional investorsdiffer in their valuation models: Whereas non-professionlas are affected by the presence of pro forma earnings (since they rely on heuristics), analysts are not (since they rely more on well-defined valuation models) • Lachmann & Stefani & Wöhrmann(2015): Non-professional investorsare more likely to acquire the information on changes in credit risk if that information is included in OCI, but the evaluation of firm performance is less biased if fair value gains are included in OCI • Hirst & Hopkins & Wahlen (2004): Income measurement (all fair-value changes recognized in income vs. some fair-value changes recognized in income, others disclosed in the notes) affects professional equity analysts’ ability to identify a bank’s exposure to interest rate • Recognition vs. disclosure How do analysts read financial statements?
Motivation How do professional investors / creditors process information contained in financial statements? • How do addressees process information contained in financial statements? • Search strategy: Sequential or directed? • Using verbal protocols on the individual level, Bouwman et al. (1997) show that the 12 financial analystsincluded in the study apply a mix of sequential and directed search strategies • Using a computerized eye-movement retinal imaging system, Hunton & McEwen (1997) (retracted) (claim to) find that more (less) accurate analysts apply a directed (sequential) search strategy • Grigg & Griffin (2014) use eye-tracking to analyze how 2 (2) participants with (without) accounting knowledge solve key issues in financial analysis How do analysts read financial statements?
Experimental Design Method • Participants see the financial statements of an existing (but unknown) Company XY and make investment / lending decisions based on this information • Computerized experiment that combines process data(collected by using eye-trackers) with decision data • Eye-tracking devices use a non-contact, optical method formeasuring eye motion; they collect data on individualeye-movements in an unobtrusive way • Eye-tracking devices get „cheap“, are small, and can betaken nearly everywhere • (Weakly) incentivized experiment (correct answers inthe acquisition task / manipulation check increase theprobability to win an 100 EUR Amazon voucher) • Comparison between investors and creditors • Professional investors and creditors as participants (exogenous) • Situations in which the company makes a profit or a loss (manipulated), random assignment of participants to treatments • Between-subjects design (each participant experiences one treatment only): 2 x 2 design How do analysts read financial statements?
Experimental Design • Calibration of the eye-tracker to the participant’s eyes • Participants see introductory pages and financial report(income statement, balance sheet, cash flow statement)of Company XY (2015 and 2014) • Task & datacollection • Profit or Loss • treatment Eye-trackercollectsprocessdata • Financial statements are still available Participants state probability to invest / lend 500 Mio. EURfor a project (return:1 percentage point above weighted costs of capital) • Investment decision Participants evaluate the performance and the insolvencyprobabilityof Company XY • Evaluation • Financial statements are not available anymore • Acquisition Did the report of Company XY contain income statement, statement of the changes in equity, balance sheet, cash flow statement, notes, and / or management report? (6 answers) Did the income statement contain certain KPIs? (9 answers) • Manipulation check Was Company XY a profit or a loss firm? (1 answer) How do analysts read financial statements?
Experimental Design • Financial statements are not available anymore Participants state relevance of KPIs for their investment / lending decision • Weighting • Task & datacollection Participants state relevance of KPIs for predicting future cash flows/ for measuring current performance • Interpretation Participants state relevance of KPIs for measuring core business / additional activities • Interpretation Participants state relevance of KPIs for measuring continuous effects / one-off effects • Interpretation Questions on risk aversion • Control Questions on gender, age, and professional experience • Demographics • Information on the number of lottery tickets earned(1 / -1 lottery ticket for each correct / incorrect answer), winner receives 100 € Amazon voucher How do analysts read financial statements?
Profit Loss Provisions increase by9500 morein the loss than in the profit treatment: Costs of goods sold are by 9500higher in the loss than in the profit treatment In 2015, all KPIs are by 9500 lower in the loss than in the profit treatment; already in 2014, comprehensive income is by 8000 lowerin the loss than in the profit treatment since costs of goods sold are by 8000 higher
Reserves (and equity)decrease by 9500 morein the loss than in the profit treatment (increase of 5784): Total decrease of 3716 Profit Loss Reservesin the loss treatment are already in 2014 by 8000 lower than in the profit treatment Provisionsincrease by9500 morein the loss than in the profit treatment (increase of 1120): Total increase of 10620 in the loss treatment Provisions in the loss treatment are already in 2014 by 8000 higher than in the profit treatment
Loss Profit Net income from continuing operations is by 9500 (2015) and by 8000 (2014) lowerin the loss than in the profit treatment The increase in provisionsis by 9500 higher in the loss than in the profit treatment
CollectingProcessData: Eye-Tracking Terms • Hypothesis: There is a link between eye movements and cognitive processes • Area of Interest(AOI): Pre-defined area on the screen • Screen measures 1080 x 1920 Pixel • One item (e.g., KPI) measures30 x 100 Pixel, the distance to the next item above / below is 18 Pixel • AOI is 48 x 100 Pixel: The AOIs adjoin, but do not overlap • Transition: Movement from one AOI to the next • Fixation: Period for which gaze is hold still; stabilized position of the retina • All information is mainly acquired during a fixation • The length of a fixation is usually an indication of information-processing or cognitive activities • Are the following 7 measurements (frequency of 60 Hertz: 116.67 ms) within a range of 40 Pixel? Fixation means that for 116.67 ms, all consecutive measurements have a distance of 40 Pixel, at the maximum • Dwell-Time: The total amount of time a participant fixates or simply glances within an AOI How do analysts read financial statements?
Participants Data collection process How do analysts read financial statements?
Participants Demographics How do analysts read financial statements?
Participants • Occupational title How do analysts read financial statements?
Performance in the Acquisition Task / Manipulation Checks Lottery tickets (max. 16) Acquisition task: Presence of … • Income statement (yes) • Statement of the changes in equity (no) • Balance sheet (yes) • Cash flow statement (yes) • Notes (no) • Management report (no) * Manipulation checks: Presence of … • Gross profit (BruttoergebnisvomUmsatz) (yes) • Earnings before interest, taxes, and depreciation (EBITDA) (no) • Earnings before interest and taxes (Gewinn vor Zinsen und Steuern) (EBIT) (yes) • Earnings before taxes (EBT) (no) • Net income from continuing operations (GewinnausfortgeführtenAktivitäten) (yes) • Net income from non-continuing operations after taxes (Gewinn aus nicht fortgeführten Aktivitäten nach Steuern) (yes) • Net income (GewinnnachSteuern) (yes) • Other comprehensive income after taxes (sonstiges Ergebnis nach Steuern) (yes) • Comprehensive income (Gesamtergebnis) (yes) • Loss / profit in 2015 How do analysts read financial statements?
Performance in the Acquisition Task / Manipulation Checks Participants calculated the EBT themselves? Probably KPI is not relevant … Probably OCI is not relevant … How do analysts read financial statements?
Performance in the Acquisition Task / Manipulation Checks Key findings • Participants mainly correctly answered the questions regarding the presence of the financial report’s elements and regarding the existence of a profit / loss • Participants more often incorrectly answered the questions on the presence of certain KPIs • The position of the KPI in the income statement does not seem to affect the likelihood of a correct answer • The difference between investors and creditors in the frequency of correct answers is not significant How do analysts read financial statements?
Risk Aversion On average, are you willing to take risks or do you try to avoid risks? *** *** *** * Driving a car Financial investments Leisure & sports Professional career Health Trust in other people ** * How do analysts read financial statements? • (0: „not willing to take risks“; 10: „risk-loving“)
What Kind of Search Strategy is Applied? Position of KPIs on the screen (revenues to CI) and Time to First Fixation (2015) Investors x Profit Investors x Loss Creditors x Profit Creditors x Loss How do analysts read financial statements?
Loss Profit 2 15 1 1 3 2 3 4 4 5 6 5 8 6 11 9 7 12 12 10 9 8 15 11 14 7 13 13 10 14 Investors x Profit Investors x Loss Order based on Time to First Fixation on value given for year 2015as participants saw the screen for the first time
Profit Loss 1 1 2 2 3 3 4 4 5 5 6 6 7 7 9 11 8 10 12 11 13 8 12 9 15 15 14 14 13 10 Creditors x Profit Creditors x Loss Order based on Time to First Fixation on value given for year 2015as participants saw the screen for the first time
What Kind of Search Strategy is Applied? Percentage of participants who fixated on the KPIs on the screen Findings • During the first visit, more participants fixate on items in the upperpart (including EBIT) than on items in the lower part(including OCI and CI) of the income statement How do analysts read financial statements?
What Kind of Search Strategy is Applied? Entropy in the scan path • „Entropyindicates the randomness in the scan pattern… a high resulting value is aligned with a preference for exploration, while low values indicate data with transitions mainly between a few AOIs in the ordered manner.“ (Holmquist& Andersson(2017), p. 480) • Low value: ordered search strategy • High value: explorative search strategy • Results: • Mean Entropy values: • The difference between investors and creditors is not significant (ANOVA) • Experience in making investment / lending decisions is associated with lower Entropy values: More experienced participants apply a more ordered search strategy (ANOVA, < 1%) How do analysts read financial statements?
What Kind of Search Strategy is Applied? Key findings • Participants mainly apply an ordered search strategy, in particular for the upper part of the income statement • up to earnings before interest, taxes, and depreciation (EBITDA) in the profit treatment • and even up to net income from continuing operations (GewinnausfortgeführtenAktivitäten) in the loss treatment • The positions shown in the lower part of the income statement seem to be of lower interest • Investors and creditors both seem to apply an ordered search strategy • Those participants with above-median experience in making investment / lending decisions apply a more ordered search strategy How do analysts read financial statements?
How is Company XY Evaluated? Decision data on the probability to invest / lend Findings • In case of a loss, the probability to invest / lend is significantly lower(ANOVA, < 1%) • There is no significant difference between investors and creditorsin the probability to invest / lend (ANOVA) *** How do analysts read financial statements? • (-1: „highly unlikely“;1: „highly likely“)
How is Company XY Evaluated? Decision data on the evaluation of the performance of Company XY Findings • In case of a loss, the performance is seen significantly more unfavorable(ANOVA, < 1%) • There is no significant difference between investors and creditorsin the evaluation of the performance of Company XY (ANOVA) *** How do analysts read financial statements? • (-1: „extremely poor“;1: „extremely good“)
How is Company XY Evaluated? Decision data on the probability of insolvency Findings • In case of a loss, insolvency is regarded as significantly more likely (ANOVA, < 1%) • There is no significant difference between investors and creditorsregarding the perceived probability of insolvency(ANOVA) *** How do analysts read financial statements? • (-1: „highly unlikely“; 1: „highly likely“)
Which KPIs are Relevant for Decision-Making? Decision data on KPIs’ relevance for making investment / lending decisions 3 1 2 3 How do analysts read financial statements? • (-1: „unimportant“; 1: „very important“ → +1)
Which KPIs are Relevant for Decision-Making? Decision data on KPIs’ relevance for making investment / lending decisions • Ifthere‘s a loss, thefollowing KPIs areperceivedassignificantlymoreimportant(ANOVA): • Gross profit (BruttoergebnisvomUmsatz) (10%) • Earnings before interest and taxes (EBIT) (Gewinn vor Zinsen und Steuern) (5%) • Net income from continuing operations(Gewinnausfortg. Akt.) (10%) • Net income from non-cont. ops. after taxes(Gewinn aus nicht fortg. Akt. nach Steuern) (1%) • Creditorsregardthenet income from continuing operations(Gewinnausfortg. Akt.) as significantly more important than investors do (10%) How do analysts read financial statements?
4 1 3 6 3 5 2 Investors x Profit Heatmap based on average number of fixations, scale based on all participants
3 1 2 6 4 7 5 Creditors x Profit Heatmap based on average number of fixations, scale based on all participants
3 1 2 6 4 7 5 Investors x Loss Heatmap based on average number of fixations, scale based on all participants
4 1 2 6 3 7 5 Creditors x Loss Heatmap based on average number of fixations, scale based on all participants
Which KPIs are Relevant for Decision-Making? Correlation between decision data on KPIs’ relevance for making investment / lending decisions and Number of Fixations (Dwell) How do analysts read financial statements?
Which KPIs are Relevant for Decision-Making? Association between Dwell for KPIs and making investment / lending decisions How do analysts read financial statements?
Which KPIs are Relevant for Decision-Making? Key findings • There are no significant differences between investors and creditors regarding the evaluation of Company XY • Participants regard the following KPIs as most important for making investment / lending decisions (decision data): • Earnings before interest and taxes (EBIT) (Gewinn vor Zinsen und Steuern) • Net income from continuing operations (Gewinnausfortg. Akt.) • Gross profit (BruttoergebnisvomUmsatz) and Earnings after Taxes (EAT) (GewinnnachSteuern) • Non-GAAP measures(e.g., gross profit (BruttoergebnisvomUmsatz) or earnings before interest and taxes (EBIT) (Gewinn vor Zinsen und Steuern) seem more important than GAAP-measures (e.g., comprehensive income (Gesamtergebnis)) How do analysts read financial statements?
Which KPIs are Relevant for Decision-Making? Key findings • Heatmapsshow that • Revenues, costs of goods sold, and gross profitreceive comparatively more attention than the KPIs that subjects indicated as important • EBIT also gets some attention (except in the creditors x loss cell), as do several entries in the upper part of the income statement(up to the net income from continuing operations (GewinnausfortgeführtenAktivitäten)) • Non-GAAP measures(e.g., gross profit (BruttoergebnisvomUmsatz) or earnings before interest and taxes (EBIT) (Gewinn vor Zinsen und Steuern) seem more important than GAAP-measures (e.g., Earnings after Taxes (EAT) (GewinnnachSteuern) or comprehensive income (Gesamtergebnis)) • The values for 2014 do not get much attention • There are significant correlations of the eye-tracking measures Number of Fixations (and Dwell) with the stated importance of an KPI only for the EBIT • Dwell on EBIT has a significant association with the decision to invest / lend How do analysts read financial statements?
Profit Investors x Loss
Profit Creditors x Loss
Which KPIs are Relevant for Decision-Making? Key findings • Heatmaps show that participants focus on these balance sheet items: • Investors x Profit: Equity (which gets more attention than any KPI from the income statement) • Investors x Loss: Equity gets less attention • Creditors x Profit: Long-term financial liabilities • Creditors x Loss: Long-term financial liabilities get less attention, short-term liabilities gain in importance • Amongtheassets, onlyintangibles, goodwill, and PPE getsomeattention • Assets seem not asimportantasequity / liabilities • The valuesfromtheprecedingyear do not seemtocauseanyinterest How do analysts read financial statements?
Loss Profit Investors x Loss
Loss Profit Creditors x Loss
Which KPIs are Relevant for Decision-Making? Key findings • Heatmaps show that participants • Do not seem to show the same interest in the cash flow statement as in the income statement • This is particularly true for the creditors How do analysts read financial statements?
Which KPIs are Relevant for Decision-Making? Number of screen visits Findings • Creditors visit the incomestatement significantly more often than investors • Creditors visit the balancesheet significantly more often than investors • Creditors visit the cashflowstatementsignificantly more often than investors *** *** * How do analysts read financial statements?
Conclusion Key findings • EBIT seems to be particularly important for making investment / lending decisions • This finding is relevant for the regulatory debate on the presentation of Non-GAAP measures: • Better ways of communicating other comprehensive income? OCI seems not to be very important… • Reviewing required minimum line itemsin primary financial statements? Probably a maximum is more helpful…. • Professionals read in an ordered manner • This finding is relevant for the development of hypotheses on the effects of the presence of information items and the choice of the presentation format How do analysts read financial statements?