Download
1 / 48
480 likes | 487 Views
This presentation explores the general demographic trends affecting the United States, focusing on the growth of population, immigration, aging, and diversity. It examines the impact of these trends on central cities and compares city trends with suburban trends. The presentation concludes by discussing the implications of these trends for urban and housing policy.

E N D
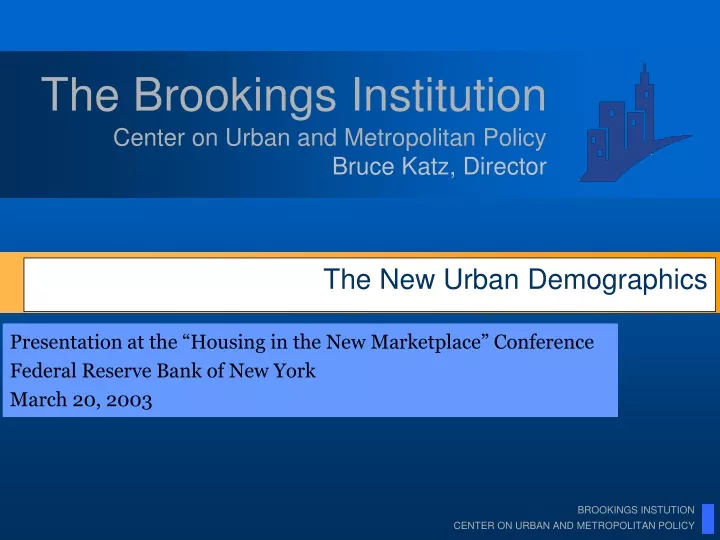
The Brookings Institution The New Urban Demographics Center on Urban and Metropolitan PolicyBruce Katz, Director Presentation at the “Housing in the New Marketplace” Conference Federal Reserve Bank of New York March 20, 2003
What are the general demographic trends affecting the United States? The New Urban Demographics I II How do these trends affect central cities? III How do city trends compare with suburban trends? IV What do these trends mean for urban and housing policy?
What are the general demographic trends affecting the United States? I THE BROOKINGS INSTITUTION CENTER ON URBAN AND METROPOLITAN POLICY
Major demographic forces are changing the United States Population Growth Immigration Internal Migration Aging THE BROOKINGS INSTITUTION CENTER ON URBAN AND METROPOLITAN POLICY
Population Growth The 1990s presented the strongest growth infour decades US population growth (millions), 1960-2000
Immigration Immigration More than 1/3 of population growth was driven by immigration
Immigration Despite a decade of rapid migration, the share of the U.S. population that is foreign-born is lower now than in the 1900s
Aging The US population is aging
Aging Minorities have younger age structures than whites Age distribution, 2020
America’s New Demographic Regions Migration growth states The New Sunbelt Diversity states Melting Pot America Slow growth states The Heartland
America’s New Regions New Sunbelt Melting Pot Heartland States Source: William H. Frey
New Sunbelt New Sunbelt: Examples Colorado Georgia Immigration Domestic Migration Natural Increase Source: William Frey.
Melting Pot Melting Pot: Examples New York California Immigration Domestic Migration Natural Increase Source: William Frey.
Heartland Heartland: Example Pennsylvania Immigration Domestic Migration Natural Increase Source: William Frey
B e l o w 1 2 . 5 % 1 2 . 5 % - 2 5 . 0 % A b o v e 2 5 . 0 % Hispanics are concentrated in Washington, California, Arizona,New Mexico, Texas, Florida and isolated urban pockets Hispanic share of population by county, 2000 Source: William Frey
B e l o w 4 . 3 % 4 . 3 % - 1 0 . 0 % A b o v e 1 0 . 0 % Asians are concentrated in California and isolated urban pockets Asian share of population by county, 2000 Source: William Frey
B e l o w 1 2 . 6 % 1 2 . 6 % - 2 5 . 0 % A b o v e 2 5 . 0 % Blacks are concentrated in the South and industrial citiesof the North African-American share of population by county, 2000 Source: William Frey
B e l o w 6 9 . 1 % 6 9 . 1 % - 8 5 . 0 % A b o v e 8 5 . 0 % Whites are principally concentrated in the heartland White share of population by county, 2000 Source: William Frey
Melting pot states include a large share of America’s diversity Foreign Born 70% Asian Language at Home 68% Spanish at Home 76% Mixed Marriages 51% Native Born 37% English at Home 34% Source: William H. Frey
Cities As a group, the largest cities grew faster in the 1990s than in the 1980s
MSA Population Change City Population Change Number of Cities City Category Rapid Growth (over 20%) 14 32% 25% Significant Growth (10 to 20%) 22 15% 22% Moderate Growth (2 to 10%) 36 7% 13% No Growth (-2 to 2%) 6 0% 11% Loss (below -2%) 20 -7% 6% Cities Cities in growing areas grew; cities in slow growthareas generally declined
Cities Many of the fastest growing cities were concentrated in the West and Southwest
Cities Central City Growth in the 1990s was fueled by Asians and Hispanics
Cities If not for Hispanic and Asian growth, city growth would have been dramatically lower
Cities In 2000, the top hundred cities became majority minority 2000
As with states, the experience of immigration and diversity varies across the country
Cities Former Gateways Share of foreign born, 1900 - 2000 Source: Audrey Singer
Cities Continuous Gateways Share of foreign born, 1900 - 2000 Source: Audrey Singer
Cities Post World War II Gateways Share of foreign born, 1900 - 2000 Source: Audrey Singer
Cities Emerging Gateways Share of foreign born, 1900 - 2000 Source: Audrey Singer
Cities Re-Emerging Gateways Share of foreign born, 1900 - 2000 Source: Audrey Singer
Cities The significant growth in cities was in non-marriedhouseholds with children and “non-families”
Cities This also varies across the country Source: William Frey. “A Census 2000 Study of City and Suburb Household Change.” Brookings, Forthcoming Atlanta, New York, Cleveland
How city trends compare with suburban trends II do THE BROOKINGS INSTITUTION CENTER ON URBAN AND METROPOLITAN POLICY
Suburbs Suburbs grew faster than cities in the 1990s Percent population growth, 1990-2000 Source: U.S. Census Bureau; cities and suburbs in the 100 largest metro areas
Suburbs Although, there is significant regional variation Percent population growth, 1990-2000
Suburbs The percent of each racial/ethnic group living in the suburbs increased substantially
Suburbs In addition, every minority group grew at faster rates in the suburbs than in central cities Percent population growth, 1990-2000
Suburbs Now more than 1 in 4 households are minority
Suburbs The suburbanization of foreign born is particularly pronounced in emerging gateways Emerging Post-WWII Re-emerging Continuous
Suburbs Every household type grew at faster rates in the suburbsthan in cities Percent population growth, 1990-2000 Source: William Frey. “A Census 2000 Study of City and Suburb Household Change.” Brookings, Forthcoming
Suburbs Growth among older individuals is more prevalent in suburbs
Policy Implications Demographics shape market demand for housing • Aging - changes lifestyle choices • Immigration - changes size and type of housing demanded • Suburbanization - changes the location of demand • Regional Economy - affects price of housing • This will differ across and within regions
Policy Implications Affordable housing policy has been devolved principally to localities over the past 20 years • Low Income Housing Tax Credit • HOME • Community Development Block Grant • Homeless Assistance Programs • Public Housing Reform
Policy Implications Federal housing policy is under attack Broader fiscal policy Low income housing tax credit HOPE VI Vouchers Public Housing Rules Federal Regulatory Policy