Download
1 / 1
10 likes | 81 Views
classroom. 1000m. CL1. Library. Off-campus. CL2. L1. L1. CL1. Ca2. CL3. 1400m. cafeteria. Other area on campus. CL2. 1000m. Ca2. 150m. CL3. Ca1. L2. L2. Ca1. 200m. 1400m. USC. Electrical Engineering Department UNIVERSITY OF SOUTHERN CALIFORNIA.

E N D
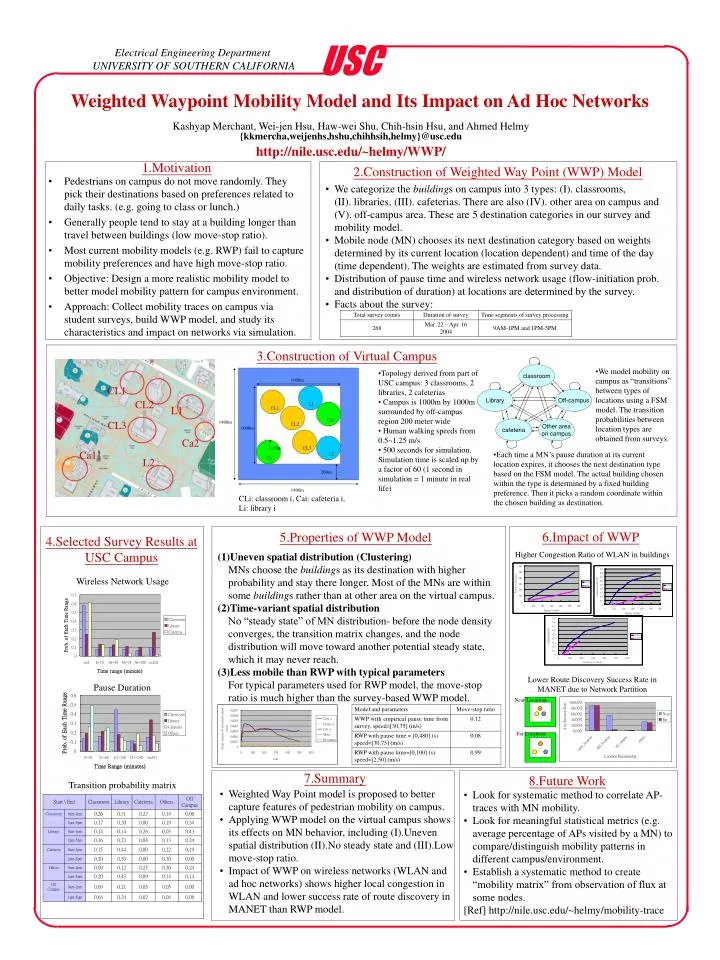
classroom 1000m CL1 Library Off-campus CL2 L1 L1 CL1 Ca2 CL3 1400m cafeteria Other areaon campus CL2 1000m Ca2 150m CL3 Ca1 L2 L2 Ca1 200m 1400m USC Electrical Engineering Department UNIVERSITY OF SOUTHERN CALIFORNIA Weighted Waypoint Mobility Model and Its Impact on Ad Hoc Networks Kashyap Merchant, Wei-jen Hsu, Haw-wei Shu, Chih-hsin Hsu, and Ahmed Helmy {kkmercha,weijenhs,hshu,chihhsih,helmy}@usc.edu http://nile.usc.edu/~helmy/WWP/ 1.Motivation 2.Construction of Weighted Way Point (WWP) Model Pedestrians on campus do not move randomly. They pick their destinations based on preferences related to daily tasks. (e.g. going to class or lunch.) Generally people tend to stay at a building longer than travel between buildings (low move-stop ratio). Most current mobility models (e.g. RWP) fail to capture mobility preferences and have high move-stop ratio. Objective: Design a more realistic mobility model to better model mobility pattern for campus environment. Approach: Collect mobility traces on campus via student surveys, build WWP model, and study its characteristics and impact on networks via simulation. We categorize the buildings on campus into 3 types: (I). classrooms, (II). libraries, (III). cafeterias. There are also (IV). other area on campus and (V). off-campus area. These are 5 destination categories in our survey and mobility model. Mobile node (MN) chooses its next destination category based on weights determined by its current location (location dependent) and time of the day (time dependent). The weights are estimated from survey data. Distribution of pause time and wireless network usage (flow-initiation prob. and distribution of duration) at locations are determined by the survey. Facts about the survey: 3.Construction of Virtual Campus We model mobility on campus as “transitions” between types of locations using a FSM model. The transition probabilities between location types are obtained from surveys. Topology derived from part of USC campus: 3 classrooms, 2 libraries, 2 cafeterias Campus is 1000m by 1000m surrounded by off-campus region 200 meter wide Human walking speeds from 0.5~1.25 m/s 500 seconds for simulation. Simulation time is scaled up by a factor of 60 (1 second in simulation = 1 minute in real life) Each time a MN’s pause duration at its current location expires, it chooses the next destination type based on the FSM model. The actual building chosen within the type is determined by a fixed building preference. Then it picks a random coordinate within the chosen building as destination. CLi: classroom i, Cai: cafeteria i, Li: library i 6.Impact of WWP 5.Properties of WWP Model 4.Selected Survey Results at USC Campus Higher Congestion Ratio of WLAN in buildings (1)Uneven spatial distribution (Clustering) MNs choose the buildings as its destination with higher probability and stay there longer. Most of the MNs are within some buildings rather than at other area on the virtual campus. (2)Time-variant spatial distribution No “steady state” of MN distribution- before the node density converges, the transition matrix changes, and the node distribution will move toward another potential steady state, which it may never reach. (3)Less mobile than RWP with typical parameters For typical parameters used for RWP model, the move-stop ratio is much higher than the survey-based WWP model. Wireless Network Usage Lower Route Discovery Success Rate in MANET due to Network Partition Pause Duration Near Locations Far Locations 7.Summary 8.Future Work Transition probability matrix Weighted Way Point model is proposed to better capture features of pedestrian mobility on campus. Applying WWP model on the virtual campus shows its effects on MN behavior, including (I).Uneven spatial distribution (II).No steady state and (III).Low move-stop ratio. Impact of WWP on wireless networks (WLAN and ad hoc networks) shows higher local congestion in WLAN and lower success rate of route discovery in MANET than RWP model. • Look for systematic method to correlate AP-traces with MN mobility. • Look for meaningful statistical metrics (e.g. average percentage of APs visited by a MN) to compare/distinguish mobility patterns in different campus/environment. • Establish a systematic method to create “mobility matrix” from observation of flux at some nodes. [Ref] http://nile.usc.edu/~helmy/mobility-trace