Download
1 / 21
220 likes | 426 Views
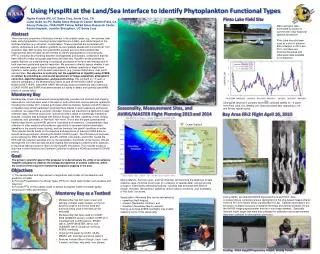
Monitoring of Phytoplankton Functional Types in surface waters using ocean color imagery C. Moulin 1 , S. Alvain 1,2 , Y. Dandonneau 3 , L. Bopp 1 , H. Loisel 2 LSCE/IPSL, Gif-sur-Yvette, France ELICO, Wimereux, France LOCEAN/IPSL, Paris, France cyril.moulin@cea.fr. ?.

E N D
Monitoring of Phytoplankton Functional Types in surface waters using ocean color imagery C. Moulin1, S. Alvain1,2, Y. Dandonneau3, L. Bopp1, H. Loisel2 LSCE/IPSL, Gif-sur-Yvette, France ELICO, Wimereux, France LOCEAN/IPSL, Paris, France cyril.moulin@cea.fr
? SEAWIFS PFT and the Ocean Carbon Cycle Recent global biogeochemical models account for more than one PFT to quantify the marine « biological pump » of CO2 Validation ? PISCES Annual mean Chl Annual mean frequency of diatom blooms
3 2,8 2,6 2,4 2,2 2 1,8 1,6 1,4 1,2 1 0,8 0,6 0,4 0,2 ? ? ? ? ? 0 460 480 520 540 560 400 420 440 500 Our goal is to identify the Phytoplankton Functional Type (PFT) associated with Chl a Chl a, the main ocean color product Chl a (mg.m-3) 0.04 nLwref(,Chl a) 0.07 0.1 Normalized water-leaving radiance 0.2 4.0 0.3 0.3 0.2 0.1 0.07 4.0 0.04 Wavelenghts(nm)
Natural variability of nLw NOMAD Is it related to PFT (at least partly) ?
SEAWIFS nLw spectra and PFT • We looked for a correlation between anomalies of the SEAWIFS nLw spectrum and the dominant phytoplankton group. • Two steps: • Develop a normalization technique to remove the 1st order Chl a effect on the nLw spectrum and to evidence a 2nd order spectral variability. • Compare nLw* spectra with coincident in situ pigment inventories from the GeP&CO dataset (Dandonneau et al., 2004) to find relationships between nLw* and phytoplankton groups. PHYSAT (Alvain et al., DSRI, 2005) nLw*() = nLw()/nLwref(, Chl a)
412 nm 3 443 nm 0.04 2,8 2,6 2,4 0.07 2,2 2 490 nm 0.1 1,8 1,6 1,4 0.2 1,2 1 0,8 0.3 510 nm 0,6 0,4 0,2 4.0 0 400 420 440 460 480 500 520 540 560 555 nm The specific normalized water-leaving radiance, nLw* nLwref(, Chl a) (nm) nLw*() = nLw()/nLwref(,Chla)
Relationships between nLw* and PFT - The GeP&CO dataset has allowed us to « identify » four groups (Diatoms, Prochlorococcus, Cyanobacteria and Haptophytes). - Three additional groups (Phaeocystis, Coccoliths and Trichodesmium) have still to be validated. Coccoliths Trichodesmium Diatoms Phaeocystis Cyanobacteria Prochlorococcus Haptophytes nLw* Wavelength
Most frequent dominant PFT for the month January 2001 The PHYSAT method Daily Level-3 GAC data nLwobs and Chl-a SeaWiFS nLw* nLw* = nLwobs/ nLwref(Chl-a) Identification of the dominant PFT for the pixel Haptophytes-Prochlorococcus-Synechococcus-Diatoms Wavelength
Haptophytes - Prochlorococcus - SLC - Diatoms -Bloom Cocco. - Phaeocystis February January March April PHYSAT 1997-2005 (Monthly Climatology)
June May July August PHYSAT 1998-2004 (Monthly Climatology) Haptophytes - Prochlorococcus - SLC - Diatoms -Bloom Cocco. - Phaeocystis
October September November December PHYSAT 1998-2004 (Monthly Climatology) Haptophytes - Prochlorococcus - SLC - Diatoms -Bloom Cocco. - Phaeocystis
Haptophytes Prochlorococcus SLC Diatomées Phaeocystis Relative fraction of total chl-a for each dominant group Haptophytes Prochlorococcus SLC Three dominant groups in the Global Ocean
0.05 0.04 0.03 0.02 0.01 North Atlantic and Pacific blooms Austral Ocean bloom Jan. 2001 June 2001 Interannual variability of « blooming » PFTs Diatoms (Relative fraction of total chl-a - Global) Phaeocystis (Relative fraction of total chl-a -Global) 0.16 0.12 0.08 0.04
July 1998 Effect of La Nina ? July 1999 The 1998 bloom of diatoms in the Equatorial Pacific Equatorial Pacific Area 1.0 Relative fraction of total chl-a for each dominant group Haptophytes Prochlorococcus SLC Diatomées Phaeocystis 0.5 0.0
Conclusions • Major Phytoplankton Functional Types are associated with specific spectral signatures that can be detected from space. • PHYSAT results are globally OK, but further validation is needed (phaeocystis, coccolithophorids, trichodesmiums,…). • PHYSAT allows to monitor the seasonal and inter-annual variability of the distributions of major PFTs. • Diatoms and Phaeocystis are the major blooming PFTs in the Austral Ocean.
In situ Seabam nLwobs and Chl-a PHYSAT data labelized as Haptophytes, SLC, Prochloroc. and Diatoms Define a bio-optical Algorithm for Haptophytes and Diatomsonly. Perspective (1): Improved bio-optical models Alvain et al., DSRI, 2006
Perspectives (2): Model validation ? SEAWIFS PISCES Annual mean Chl Annual mean frequency of diatom blooms
Perspectives (3): Intercomparison of PFT’s algorithms PHYSAT is not the only existing method to identify PFTs from space. (but it is the only one that both relies on the analysis of the nLw spectrum and allows a global processing) A recent IOCCG working group is dedicated to the comparison of existing PFT’s algorithms.
THE GEP&CO DATASET 20 pigments were measured daily (5 observations per day) during 12 GeP&CO cruises from France to New Caledonia between November 1999 and July 2002. • Nov. 1999 • Feb. 2000 • May 2000 • Aug. 2000 • Oct. 2000 • Feb. 2001 • Apr. 2001 • Jul. 2001 • Oct. 2001 • Jan. 2002 • Apr. 2002 • Jul. 2002 Gep&Co Shipping track http://www.lodyc.jussieu.fr/gepco/
10 100 1000 m Phaeocystis and Diatoms in the Austral Ocean PHYSAT January 2001 (diatoms, phaeocystis-like) Climatology of the mixed-layer Depth for January (Boyer Montégut et al., 2004).