Download
1 / 19
200 likes | 442 Views
Biostatistics Breakdown Common Statistical tests. Special thanks to: Christyn Mullen, Pharm.D. Clinical Pharmacy Specialist John Peter Smith Hospital. Objectives. Briefly review important terms needed to understand common types of statistical analysis

E N D
Biostatistics BreakdownCommon Statistical tests Special thanks to: Christyn Mullen, Pharm.D. Clinical Pharmacy Specialist John Peter Smith Hospital
Objectives • Briefly review important terms needed to understand common types of statistical analysis • Review the different types of data and how they determine what type of statistical analysis is appropriate to use • Explore real examples of common statistical analysis and their relevance to that particular study
Types of Variables • Independent • Variables that occur regardless of other variables or factors • Intervention in a trial • Dependent • Variables that are dependent upon other variables or factors • Outcome in a trial
Measures of Variability • Range • Interval between lowest and highest values within a data set • Interquartile Range • Describes interval between 25th and 75th percentile (middle 50% of measures) • Standard Deviation • Describes the distribution of values in a data set by comparing each measured value to the mean (continuous data only) • Variance • Deviation from the mean
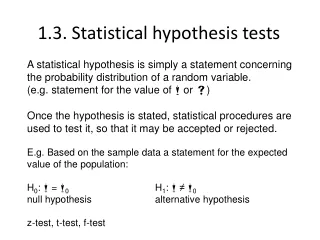
Statistical Significance • P-Value – indicates statistical significance • A p-value < 0.05 means that 5% of the time, the null could be rejected in error • Confidence Interval (typically 95%) • The range in which sample values are likely representative of the true population • Power • The ability of a study to detect specified differences between groups • Increasing sample size can increase power
Student t-test • Compares means of 2 groups • ANOVA assumptions • Data have normal distribution • Each observation is independent of the others • The variances within the groups being compared are equal
Mann-Whitney and Wilcoxan Rank • Non-parametric equivalent to t-test • Kruskal- Wallis with multiple comparison correction • Wilcoxan signed-rank • Alternative to log-rank analysis used in Kaplan Meier Regression
Chi-square (X2) • Compares categorical variables to see if there is a difference • Fisher’s exact test • For a smaller sample size (n < 5) • Mantel – Haenszel • Adjusts for confounding variables • McNemar • Analyzes results from studies with related or dependent measures
Regression • Predicts the effect of independent variables on the outcome (Framingham Risk Score) • Multiple linear regression • Used when outcome data is continuous • Logistic regression • Used when outcome data is categorical (binary)
Relative Risk and Odds Ratio • Relative Risk • Ratio of incidence of disease in exposed group divided by incidence in unexposed group • Cohort Studies • Odds Ratio • Odds of exposure in the group with the disease divided by odds in control group • Case-Control Studies (approximates relative risk b/c patients already have the disease) • If the Confidence Interval includes 1, there is NO statistical difference between groups
Survival Analysis • Kaplan- Meier Curve • Assesses time to an event • Log-Rank test will tell if differences between 2 groups are significant • Cox Proportional Hazard Model • Assesses the effects of covariates (2 or more) on survival or time to an event (adjusts for confounders) • Uses Hazard Ratio as a function of relative risk
Propensity Matching • Used to decrease selection bias by matching participants based on characteristics • Matching can be done based on a score • Can set number of significant digits depending on how precise you want to be • Allows for a more confident assessment of the intervention • Instrumental variable analysis • Gives each participant a probability of receiving an intervention and then apply it to an entire group (grouped-treatment rate) • Takes away selection bias based on prognosis or prescriber preference
References • Allen, J. Applying study results to patient care: Glossary of study design and statistical terms. Pharmacists Letter.. 2004;20:3-14. • Gaddis, GM and Gaddis, ML. Introduction to biostatistics: Parts 1-6. Annals of Emergency Medicine. 1990; 19. • Israni, RK. ‘Guide to Biostatistics.” MedPageToday. 2007. http://medpagetoday.com • DeYoung GR. Understanding statistics: An approach for the clinician. Pharmacotherapy Self-Assessment Program, 5th Edition. Pg 1-15. • Al-Qadheeb NS, et al. Impact of enteral methadone on the ability to wean off continuously infused opioids in critically ill, mechanically ventilated adults: A case control study. The Annals of Pharmacotherapy. 2012;46:1160-1166. • Marcus M, et al. Kinematic shoulder MRI: The diagnostic value in acute shoulder dislocations. European Radiology. 2012;1-6. • Stefan MS, Rothberg MB, Priyaa, et al. Association between B-blocker therapy and outcomes in patients hospitalized with acute exacerbations in chronic obstructive lung disease with underlying ishaemic heart disease, heart failure or hypertension. Thorax. (2012): DOI:10.1136/Thorax.JNL-2012-201945 • http://stat.ethz.ch/education/semesters/ss2011/seminar/contents/presentation_2.pdf. Accessed 20 Sept 2012. • http://www.gog.org/sdcstaff/MikeSill/Classes/STA575/Lectures/LectureNotesChp5.pdf. Accessed 25 Sept 2012. • https://statistics.laerd.com/spss-tutorials/mann-whitney-u-test-using-spss-statistics.php. Accessed 24 Sept 2012. • http://www.experiment-resources.com/mann-whitney-u-test.html. Accessed 26 Sept 2012.