Download
1 / 27
270 likes | 380 Views
What’s wrong with correlation analysis?. Friedo Dekker ERA-EDTA Registry / LUMC. Nothing!. Unless…. How large do you estimate the correlation between MDRD and Cockcroft-Gault?. 0.2 0.4 0.6 0.8. It depends…. On what?. N=100. N=10. 10. 20. 30. 10. 20. 30.

E N D
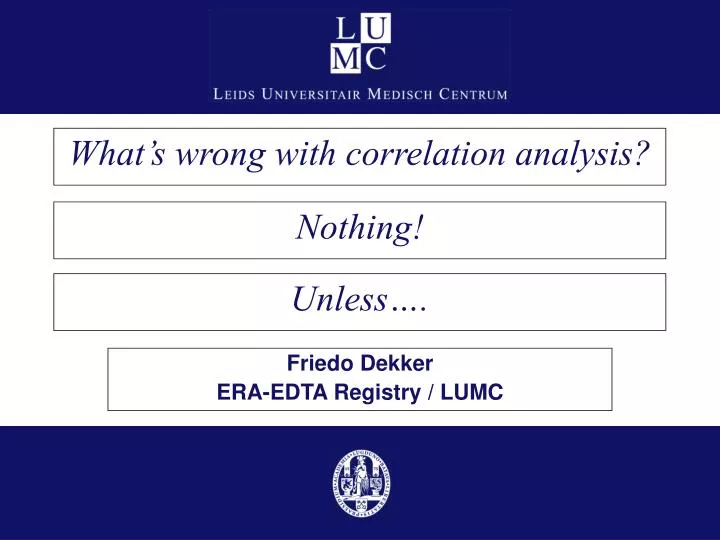
What’s wrong with correlation analysis? Friedo Dekker ERA-EDTA Registry / LUMC Nothing! Unless….
How large do you estimate the correlation between MDRD and Cockcroft-Gault? • 0.2 • 0.4 • 0.6 • 0.8 FWD
It depends…. On what? FWD
N=100 N=10 10 20 30 10 20 30 What influences the size of the correlation coefficient? Example: Correlation between MDRD and C-G • Sample size? • Statistical significance? (p-value) • Measurement error? (random error, variability) No No Yes FWD
10 20 30 50 60 70 What influences the size of the correlation coefficient? Example: Correlation between MDRD and C-G • Mean eGFR of population? (e.g., 20 vs 60 ml/min) No FWD
10 20 30 10 20 50 30 40 60 50 70 60 What influences the size of the correlation coefficient? Example: Correlation between MDRD and C-G • Range of GFR in population? (e.g., 10-30 vs 10-60 ml/min) What influences the range of GFR?? Yes Researcher! FWD
10 20 30 10 20 30 What influences the size of the correlation coefficient? • systematic difference or bias? No FWD
10 20 30 10 20 30 What influences the size of the correlation coefficient? • Slope of the relationship? (slope of regression line) No FWD
What is a correlation coefficient? • Ranges from -1 to 0 to +1 • Measure of linear association • Extent to which data are on ‘a’ straight line • [PM clinical relevant? Most of the time perhaps we want to know ‘on which line’ data are] • R2 = % explained variance: if all data are on straight line 100% of variation in one variable is explained by variation in the other variable FWD
Y X Correlation coefficient “has something to do with length and width” FWD
Correlation coefficient (1) r = 0 r = 1.0 r = 0.5 r = - 0.5 FWD
Correlation coefficient (2) r = 0 r = 0 FWD
Y X How to calculate a Correlation coefficient FWD
Y +/+ -/+ -/- +/- X Correlation coefficient is sum of cross-products* r = Σ(X*Y)/n * r = Σ(X*Y)/n with both X and Y standardized towards mean=0 and SD = 1 FWD
What’s wrong with correlation analysis? (1) • As a researcher, I can directly influence the size of the correlation coefficientby increasing range (low through high GFR values) • As a researcher, I can directly influence the statistical significance of the correlation coefficient by increasing sample size (even very low correlations become significant) FWD
What’s wrong with correlation analysis? (2) When measuring agreement, the correlation coefficient is NOT influenced if: • Mean difference between measures ≠ 0 (systematic difference or bias) • Slope of the relationship ≠ 1 (over or underestimation at higher values) FWD
All these scatterplots have same correlation coefficient: FWD
What’s wrong with correlation analysis? (3) The correlation coefficient DOES tell me: • To what extent data are on ‘a’ straight line The correlation coefficient does NOT tell me: • What line fits best through the data • Size of the error you make if you use one method in stead of the other method FWD
Which correlation is highest? Children vs Adults Children Adults “The coefficients of correlation were even better (…) in children than in adults”. Kidney International 2003 FWD
WHYis correlation higher in children than in adults? Children Adults “The coefficients of correlation were even better (…) in children than in adults”. Kidney International 2003 FWD
WHY is correlation higher in children than in adults? Children 180 180 Adults “The coefficients of correlation were even better (…) in children than in adults”. Kidney International 2003 FWD
Which agreement is best? Cockcroft-Gault vs Schwartz in children Kidney International 2003 FWD
Bland – Altman plot Lancet 1986 • Agreement difficult to see from scatterplot • Regressionline is somewhat better than sole correlation coefficient • Even better to plot difference against the mean • 95% of differences are between ‘limits of agreement’ (mean +/- 2 SD) • Bland JM, Altman DG. Statistical methods for assessing agreement between two methods of clinical measurement. Lancet 1986; i, 307-310. • Most cited paper of The Lancet (>10,000 times cited) FWD
Bland – Altman plot Lancet 1986 • Mean difference between Schwartz and Inulin clearance = 20 ml/min • 95% of differences between -60 and 20 (limits of agreement) • Larger difference at higher values Kidney International 2003 FWD
Which agreement is best? Cockcroft-Gault vs Schwartz in children Cockcroft Gault Schwartz Kidney International 2003 FWD
Assessing agreement between measurements • Use Bland-Altman plot in stead of correlation • Clinical interpretation of expected differences FWD
What’s wrong with correlation analysis? Nothing! Unless…. F.W.Dekker@lumc.nl FWD