Download
1 / 24
270 likes | 563 Views
Population Dynamics, Carrying Capacity, and Conservation Biology. G. Tyler Miller’s Living in the Environment 13 th Edition Chapter 9. Dr. Richard Clements Chattanooga State Technical Community College. Key Concepts. Factors affecting population size. Species reproductive patterns.

E N D
Population Dynamics, Carrying Capacity, and Conservation Biology G. Tyler Miller’s Living in the Environment 13th Edition Chapter 9 Dr. Richard Clements Chattanooga State Technical Community College
Key Concepts • Factors affecting population size • Species reproductive patterns • Species survivorship patterns • Conservation biology and human impacts on ecosystems
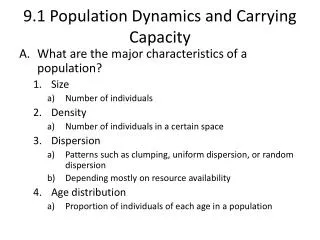
Population Dynamics and Carrying Capacity • Population dynamics: changes in a population due to environmental stress and changes in environmental conditions • Change in • Size: numbers of organisms in population • Density: organism per area • Dispersion: spatial patterns • Age distribution: proportion of individuals of age in a population
Population Dynamics and Carrying Capacity • Variables for changes in population size: • Birth 3. Death • Immigration 4. Emigration Relationship: (birth + immigration) – (death + emigration) = population change Zero Population Growth: increases in population cancel out decreases
Population Dynamics and Carrying Capacity • Biotic potential (intrinsic rat of increase [r]): capacity for growth; [r] is the rate at which population would grow with no limit in resources • Environmental resistance: factors that limit population growth • Carrying capacity (k): determined by biotic potential and environmental resistance • Minimum viable population (MVP): minimum population to maintain theintrinsic rate of increase. If not maintained population loses genetic diversity due to lack of mates and interbreeding
Population Dispersion Clumped is the most common due to resources being found in patches Fig. 9-2 p. 191
Factors Affecting Population Size biotic factors increase population growth and environmental factors decrease population growth. Balance of the two determines the population size. Fig. 9-3 p. 192
Exponential and Logistic Growth Exponential growth: few if any resource limitations on growth Starts out slow and then increases exponentially as the population grows Yields a J-shaped exponential growth curve • Logistic growth: growth that has resource limitations • Starts out slow and then progresses to a period of exponential growth until environmental resistance is encountered and the population levels off at the carrying capacity. • Yields an S-Shaped logistic growth curve
Exponential and Logistic Growth Fig. 9-4 p. 192 Fig. 9-6 p. 193 Fig. 9-5 p. 193
Exponential and Logistic Growth Fig. 9-6 p. 193 Fig. 9-5 p. 193 Populations do not stay constant in size over time many shifts in resources will effect how a populations growth continues.
Population Density Effects • Density-independent controls: Affects population size equally regardless of their density. natural disasters. • Density-dependent controls: density of the population determines the overall affect. Competitions for resources, predation, parasitism, and disease
Natural Population Curves Stable:fluctuates above and below carrying capacity Irruptive: population erupts to a high peak and then crashes Irregular: populations change irregularly for unknown reasons Cyclic: sharp increases in population followed by crashes over fairly regular intervals. Fig. 9-7 p. 194
The Role of Predation in Controlling Population Size • Top-down control: predator controls the cyclic fluctuations of the prey • Bottom-up control: herbivore-plant interaction influences the cyclic fluctuations of the predator Fig. 9-8 p. 195
Reproductive Patterns and Survival • Asexual reproduction: produces exact genetic copies (clones) of a single parent. • Sexual reproduction: produces offspring by combining gametes (sex cells; egg or sperm) from both parents. Combinations of traits (from the parents) seen in the offspring
Reproductive Patterns and Survival • Sexual reproduction: disadvantages • Females have to produce twice as many offspring to maintain the same number of young in the next generation as an asexually reproducing organism because males do not give birth. • Increase in genetic errors • Mating costs: time for courtship and mating, disease transmission, and injury inflicted by males during mating
Reproductive Patterns and Survival • Sexual reproduction: Advantages • Why do 97% of organisms sexually reproduce??? • It provides a greater genetic diversity in the offspring • Males provide for females and offspring in many species.
Reproductive Patterns and Survival • r-Selected species: high intrinsic rate of increase ( r ). Opportunistic species. • K-Selected species:competitor species due to their populations surviving in highly competitive conditions when their population size is near the carrying capacity (k). Much more stable species.
Reproductive Patterns and Survival Fig. 9-10p. 196
Survivorship Curves Way of representing the age structure of a population is a survivorship curve. Survivorship curves show the number of survivors of each age group for a particular species. (rate of mortality) Types: Early loss: K-selected species Late loss: r-selected species Constant loss curve: organisms with intermediate reproductive patterns and constant rate of mortality in all age classes.
Life Tables Shows the number of individuals at each age from a survivorship curve. It illustrates the projected life expectancy and probability of death for individuals at each age. Used by life insurance companies to determine policy costs.
Survivorship Curves Fig. 9-11 p. 198
Conservation Biology: Sustaining Wildlife Populations • Conservation biology: a multidisciplinary science, originated in the 1970’s that uses the best available science to take action to preserve species and ecosystems. • Ideas for maintaining biodiversity • Endangered species management • Bioinformatics:a new discipline that provides tools for storage and access to key biological information and builds data bases that contain the needed biological information
Human Impacts on Ecosystems • Habitat degradation and fragmentation • Ecosystem simplification: monoculture • Genetic resistance: overuse of pesticides and bacteria • Predator elimination • Introduction of non-native species • Overharvesting renewable resources: overgrazing • Interference with ecological systems: chemical cycling and energy flow
Learning from Nature • Interdependence: everything is connected to everything else • Diversity:helps maintain the sustainability and ecological functioning of ecosystems • Resilience: most populations are naturally resilient however we need to allow them to rebound • Adaptability: driven by biodiversity and aids in the sustainability when environments change • Unpredictability: human interference often has unpredictable side effects • Limits: all populations have limits to growth and resource consumption