Download
1 / 15
150 likes | 202 Views
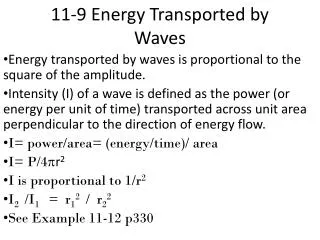
Lutocline formation by waves. Susana B. Vinzon Universidade Federal do Rio de Janeiro. Lutoclines :Steps in suspended sediment concentration. Lutocline generation: source of sediments?. Ressuspension from the bottom by tidal currents and/or waves Deposition from suspension. flood-ebb.

E N D
Lutocline formation by waves Susana B. Vinzon Universidade Federal do Rio de Janeiro
Lutoclines :Steps in suspended sediment concentration Lutocline generation: source of sediments? Ressuspension from the bottom by tidal currents and/or waves Deposition from suspension flood-ebb slack
Secondary Primary 320 g/l Tidal currents: Amazon Shelf data AMASSEDS project
Hindered settling effect: Hindered Settling Flocculation
Lutocline simulations s:uniform Ws: uniform
Lutocline generation by waves Steady state turbulent kinetic energy balance Shear production Buoyancy Dissipation Wave-mean turbulence intensity (Sleath,1991)
Laboratory results: ws = 0.05 mm/s kr = 2 cm
Discussion • Closer look at the wave turbulence model (for field conditions) • Limitation of the lab experiments (Re) • The model considers no erosion threshold
depth Time depth
First Hypothesis Second Hypothesis Mud layer High measured velocities near bottom because the profiler don’t find the true bottom No mud layer High measured velocities near bottom due to log profile
How to know which one is correct?Do we need new field techniques for measuring SSC and velocities below the primary lutoclines?