Download
1 / 78
780 likes | 783 Views
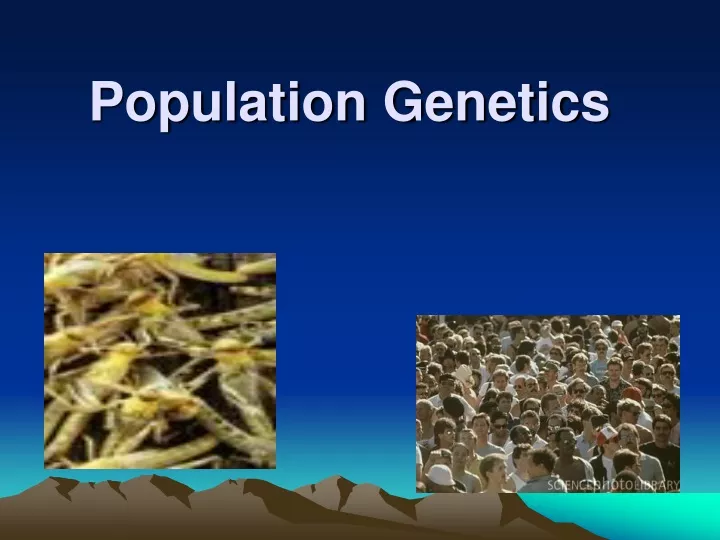
Population Genetics. The modern theory of evolution recognizes that the main source of variation in a population lies in the differences in the genes carried by the chromosomes. Genes determine an organism’s appearance and mutations can cause new variations to arise.

E N D
The modern theory of evolution recognizes that the main source of variation in a population lies in the differences in the genes carried by the chromosomes. Genes determine an organism’s appearance and mutations can cause new variations to arise. These variations can be passed from one generation to another.
Certain genotypes may be better equipped for survival than others. They may be better at obtaining food and water, protecting themselves from predators or have a higher reproductive potential. When these organisms reproduce, these “successful” genes will be transmitted to the offspring. The offspring will be better able to survive; therefore, subsequent generations would have an increased frequency of these “successful” variant genes. Consequently, there would be natural selection, within the group, of individuals better adapted to prevailing conditions.
Genes in Human Populations • The principles of genetics, established by studies on plants and fruit flies, can be applied to humans. • However, the study of human genetics presents some unique problems: • Unlike garden peas and Drosophila, humans produce few offspring, which makes it difficult to determine the genotypes of both parents & offspring for any particular trait. • Observing successive generations takes time. Drosophila can reproduce every 14 days. • Many human traits, including body size, weight and intelligence, are affected by environment as well as genes.
Population Sampling is one of the most common ways to study human populations. A representative group of individuals within the population is selected and the trends or frequencies displayed by the group are used as indicators for the entire population. Eg. Trait for tongue rolling is sampled this way. Approximately 65% of the population carry this dominant gene.
A population consists of all the members of a species that occupy a particular area at the same time. Ex. Perch population of Lake Wabamun, dandelion population of school field. The members of a population are more likely to breed with one another than with other populations of the same species. Therefore, genes tend to stay in the population for generation after generation. The total of all the genes in all the members of a population at one time is called the population’s gene pool. Evolution is the change in the frequency of genes in a population’s gene pool from one generation to the next.
Hardy-Weinberg Principle • 1908 – G.H. Hardy & W. Weinberg, independently derived the basic principle of population genetics, the Hardy-Weinberg principle. • This law states that the frequencies of alleles in a population’s gene pool remain constant over generations if all other factors stay constant (genetic equilibrium). • Provides a model of an unchanging gene pool.
Allele frequency is the proportion of gene copies in a population of a given allele • Changes in the population can be measured by looking for changes in the allele frequency • A fixed frequency is when there is only a single allele
The conditions under which no change will occur are: • 1) The populations must be closed (no immigration/emigration) • 2) Random mating takes place (no mating preferences with respect to genotype) • 3) No selection pressure. A single gene must not affect the survival of the offspring • 4) No mutations • 5) Population must be large
If all of these conditions are met, the frequencies of two alleles, for example A and a, will remain constant in a population for an indefinite time (until conditions change). The mathematical expression for the Hardy-Weinberg equilibrium is as follows: p + q = 1 p= frequency of the dominant allele q= frequency of the recessive allele p2 + 2pq + q2 = 1 genotype frequency AA Aa aa p2= frequency of genotype AA 2pq= frequency of genotype Aa Q2= frequency of genotype aa
Example: Suppose a certain allele A has a frequency of 0.6 in a population. The frequency of allele a must be 0.4 because A + a must equal 1. (1 – 0.6 = 0.4). Let’s see what happens during reproduction. We can arrange the alleles and their frequencies in a Punnett square. A (0.6) a (0.4) A (0.6) AA (0.36) Aa (0.24) a (0.4) Aa (0.24) aa (0.16) Genotype ratio: 36% AA; 48% Aa: 16% aa Unlike the genetic Punnett square used to determine individual traits, the eggs & sperm of this Punnett square represent the genes for the entire population. Or use Hardy Weinberg: Frequency of AA = p2 = (0.6)2 = 0.36 Frequency of Aa= 2pq = 2(0.6x0.4)= 0.48 Frequency aa = q2 =( 0.4)2 = 0.16
Calculate the number of individuals of each genotype in a population of 8000 individuals. AA Aa aa 0.36 0.48 0.16 2880 3840 1280
Suppose a certain allele A has a frequency of 0.7 in a population (found in 70% of the genes). Calculate the expected frequencies of the three possible genotypes. Therefore 0.7 = A frequency which is the dominant allele = p 1- p(0.7) = 0.3 p2 =(0.7)2 = 0.49 2pq = 2 (0.7 x 0.3) = 0.42 q2 = (0.3)2 = 0.09 AA = 0.49 or 49% Aa = 0.42 or 42% Aa = 0.09 or 9%
If we were just given the distribution of genotypes, how could we predict the frequency of the A and a alleles? Ex.) Given the frequency of a recessive trait as 4%, what are the allele frequencies? q2 = 4% = 0.04 q = square root 0.04 = 0.2 p + q = 1 1 - 0.2 = p (0.8) p2 =(0.8)2 = 0.64 2pq = 2 (0.8 x 0.2) = 0.32 q2 = (0.2)2 = 0.04
Hardy-Weinberg purposely ignored the external factors that influence populations. The Hardy-Weinberg principle points out that sexual reproduction reshuffles genes but does not by itself cause evolution, which is caused by a change in allele frequencies. If the population does not demonstrate H-W equilibrium, (i.e. it’s gene frequencies are not stable), it is in evolutionary change!
Do Now • What are the 5 conditions that must be met so that genetic equilibrium stays the same? • Define: • Population • Gene pool • Evolution
Factors that bring about Evolutionary Change • A population’s gene pool is very unstable. It is constantly influenced by external factors – factors that were intentionally ignored by Hardy and Weinberg. • These factors change a population’s genetic makeup, upset the tendency toward genetic stability & lead to evolutionary change. • (microevolution – a change in the gene pool of a population over successive generations).
1) Natural Selection • The nonrandom survival & reproduction of certain genotypes from one generation to the next. • Certain traits may be selected for, while others may be selected against. • Ex. In North America, individuals who are homozygous for normal hemoglobin have a selective advantage over those who are heterozygous or homozygous for the sickle cell allele. • Eg. Peppered moth in England.
2) Mating Preferences (mating may not be random) • If females consistently choose to mate with males having certain genetic traits, they exert selection in favor of those traits.
3) Mutations • A mutation is any inheritable change in the DNA of an organism. • Mutations occur in a cell as it undergoes meiosis to form an egg or sperm. • Two types: • Chromosome Mutation – results from nondisjunction, chromosomal breakage or translocation • Gene Mutation – changes in the nucleotides of a DNA model
If the mutation gives selective advantage to individuals carrying it, then it will increase in frequency and the population gene pool will change over successive generations. Mutations, in and of themselves, are neither good nor bad. A mutation considered beneficial in one environment may be detrimental in another environment.
Ex. Sickle Cell Anemia & Tay-Sachs Disease • Both homozygous recessive conditions. • Carriers (heterozygotes) are usually symptom free. • This is why disease still exists, or it would be selected out of the population. • Tay Sachs is a fatal genetic disease • Sickle cell anemia can be treated (not cured), and sometimes can be fatal • African and south eastern Asian– high incidence of sickle cell anemia and a high incidence of malaria. This is due to the fact that sickle cell carriers provided immunity to the malarial parasite. • Eastern Jewish Populations – High incidence of Tay Sachs and a high incidence of tuberculosis. Tay Sachs provided immunity for the Jewish people from tuberculosis
4) Genetic Drift • Evolution can occur simply by chance. • Random events may bring death or lack of parenthood to some individuals. As a result, alleles may disappear from a population. • Ex. Population of 10 guinea pigs. Only one member displays an allele B, for black coat color. If the black individual does not mate, the black allele will disappear from the population. • Genetic drift is more important in small populations than in large ones. (H-W principle applies to large populations and is based on the laws of probability rather than natural selection). • Founder effect is a genetic drift that results when a small number of individuals separate from their original population
5) Gene Flow (Migration) • Movement of members into immigration, or out of emigration, a population alters its equilibrium. • In immigration, new genes are added to the population. • In emigration, genes are removed from the population.
Speciation • Speciation refers to the formation of a new species. • There is an enormous diversification between species that evolution alone cannot explain. • A group of similar organisms that can interbreed and produce fertile offspring in the natural environment.
It is important to note that speciation and evolution are NOT necessarily the same. Natural selection does not always cause speciation! (Ex. The evolution of the peppered moth did not lead to a new species). How does speciation occur???
a. Instantaneous Speciation • Occurring in one generation because of major changes to the chromosomes • Usually a result of nondisjunction • Polyploids can mate with each other, but not with members of parent generations, because of different chromosome numbers.
b. Gradual Speciation • Most species arose slowly and gradually evolved differences through time. • i.e. Galapagos finches
c. Geographic Speciation • Speciation occurs if a population is divided into 2 or more smaller populations, that are physically separated from one another. • i.e. mountains or bodies of water from floods establish physical barriers. Over time the species cannot reproduce within the original group
d. Punctuated Equilibrium • Periodic rapid evolution (within 100-1000 generations ) followed by little change over a long time • Suggests that population remain stable and unchanging for very long periods of time
e. Phyletic Gradualism • Evolution occurs at a constant rate over time
Chapter 22 Population Changes
Populations and Communities • a population refers to all of the individuals of the same species living in the same place at a certain time. • a community is made up of the populations of all organisms that occupy an area. • the study of a community involves only the organisms, whereas the study of an ecosystem involves that abiotic and biotic components of an area.
A habitat is the physical area where a species lives • Within a habitat, every population occupies an ecological niche – this is referred to as the populations ecological role in the community, including the biotic and abiotic factors under which a species can successfully survive and reproduce.
Do Now • Make sure you have a calculator! If you don’t have one, GET ONE NOW! • Also make sure you have your textbook today.
Distribution of Populations • Population patterns can be divided into three patterns: 1. Clumped distribution • occurs when individuals are grouped in patches or aggregations • organisms are distributed according to certain environmental factors (abiotic factors) • ex.) in river valleys, trees often grow only on the south slopes and grasses dominate the north slope – plant distribution is found in “clumps”
2. Random distribution - occurs when there is neither attraction nor repulsion among members of the population - arbitrary and not very common 3. Uniform distribution - occurs when there is competition among individuals for factors such as moisture, nutrients, light and space ex.) grass, cacti in deserts
Size and Density of Populations • population size: the number of organisms of the same species sharing the same habitat at a certain time • these numbers may arise from an exact count or an estimate of the total population size using sampling methods • ex.) In 1981, there were 27642 northern pike in Sylvan Lake, Alberta • population density: the number of organisms per unit space
the density (D) of any population is calculated by dividing the total numbers counted (N) by the area (A) occupied by the population: Dp= N Dp = N A or V (volume) ex.) If 200 lemmings were living in a 25ha (hectare) area of tundra near Churchill, Manitoba in 1980, their population density would be: D = N = 200 lemmingsD = 8 lemmings / hectare A 25 hectares
We can compare population densities by determining if there have been changes within the same population over a certain time period (we call this the rate of change) • Rate of density change can be expressed as follows: Growth rate = change in density or gr = ∆D change in time T • D (gr) must be calculated showing the most recent dates minus the density at the earliest date – this will show whether there has been an increase or decrease in the population. Same as growth rate formula!
ex.) If in 1990, the lemming population of Churchill, Manitoba was 22 lemmings/ha and in 1980 the population density was 8 lemmings/ha what is the change in population density from 1980 to 1990? D 1980 = 8 lemmings/ha D 1990 = 22 lemmings/ha gr = D = D 1990-D1980 = 22 lem./ha - 8 lem./ha T 10 years = +1.4 lemmings/ha/year Note: must put + or – to show increase or decrease!!!!
Population Growth Patterns • Four factors determine population size: 1. Natality: the number of offspring of a species born in one year 2. Mortality: the number of individuals of a species that die in one year 3. Immigration: the number of individuals of a species moving into an existing population 4. Emigration: the number of individuals of a species moving out of an existing population
Population growth can be determined by the following formula: ∆N= (natality (n) +immigration (i)) – (mortality (m) + emigration (e)) ∆N = (n+i)-(m+e) x 100 initial # of organisms ∆N = (b+i)-(d+e) x 100 n
Ex. If a colony of 200 cranes had 40 births & 55 deaths, with no migration, what is the population growth? • PG = 40 – 55 x 100 200 PG = - 7.5% Population was deceasing.
Growth Rate • How quickly a population is increasing or decreasing • Gr= ∆N ∆t • Per Capita Growth Rate represents a change in population size relative to the initial size • Cgr= ∆N N
To Do • Look over sample problem 1 on page 744 • Try practice questions 1 and 2 on page 745
In mature ecosystems, populations tend to remain relatively stable over the long term – this is called dynamic equilibrium or steady state • Dynamic equilibrium is similar to homeostasis; populations will adjust to changes in the environment to maintain equilibrium • Populations can either be classified as “open” or “closed” • In open populations, all four factors (natality, mortality, immigration and emigration) are functioning • In closed populations, immigration and emigration do not occur, so changes in natality and mortality will be the only factors that influence population size
J Curve Graph • J-shaped population curves (ideal environment) • If a few relatively active individuals are placed in an ideal environment: unlimited space, food, water, without disease and predation, the population can be expected to reproduce at its maximum physiological rate. • Only limiting factors would be the rate of gamete formation, mating and survival of offspring. • This would be shown on a J-shaped curve. • results when rapid population growth is followed by a sharp decline in the population • the quick increase in population can cause an exceeding of the carrying capacity, which then causes a sharp population decrease • it is usually followed by a relatively stable stationary phase