Download
1 / 9
90 likes | 97 Views
Simulation. Discrete Variables. What is it?. A mathematical model Probabilistic Uses the entire range of possible values of a variable in the model. Why Simulate?. Safety – flight simulator

E N D
Simulation Discrete Variables
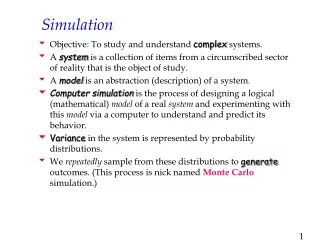
What is it? • A mathematical model • Probabilistic • Uses the entire range of possible values of a variable in the model
Why Simulate? • Safety – flight simulator • Cost – easier to simulate adding a new runway and find out effects than to implement in reality and then find out • Time – Boeing uses simulated manufacturing before the real thing, with tremendous savings in time and money – can discover parts that do not fit and fix them before actual production
How does it work? • Simulation requires you to know • What variable is to be simulated • The distribution of the variable – values it can take on and the probabilities of those values occurring. • Step 1: Generate a variable containing uniformly distributed random variables between 0 and 1 (the rand() function in Excel). • Step 2: Create a rule to map the random numbers to values of the variable desired in the right proportion, and apply the rule.
Example – coin toss • Variable to be simulated is “Outcome of a coin toss”. It takes on values “Heads” and “Tails”, each with 0.5 probability. • Generate 100 random numbers (100 tosses of coin). • Make a rule like – if random number > 0.5, then “Heads”, else “Tails”. This will create the right distribution of outcomes.
Example 2: Machine Failures • Simulate machine failures based on this historical data
Simulating Machine Failures, contd. Create the following cumulative probability table.
0 0.60 0.93 0.98 Simulating Machine Failures, contd. • Now map the random numbers between 0 and 1 using the cumulative prob. Column as the cutoffs. • Random numbers between 0 and 0.6 represent 0 failures, between 0.6 and 0.933 represent 1 failure, and so on. 0 failures 1 failure 2 3 failures
Solution – Random Number Mapping The random numbers are now mapped to number of failures as follows.