Download
1 / 24
240 likes | 355 Views
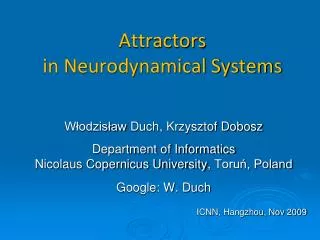
Fuzzy Symbolic Dynamics for Neurodynamical Systems. Krzysztof Dobosz 1 and Włodzisław Duch 2 1 Faculty of Mathematics and Computer Science, 2 Department of Informatics Nicolaus Copernicus University, Toruń , Poland kdobosz@mat.umk.pl, Google: W. Duch

E N D
Fuzzy Symbolic Dynamics for Neurodynamical Systems Krzysztof Dobosz1 and Włodzisław Duch2 1 Faculty of Mathematics and Computer Science, 2 Department of Informatics Nicolaus Copernicus University, Toruń, Poland kdobosz@mat.umk.pl, Google: W. Duch ICANN 2008, Prague, 3-6 September 2008
Introduction • Neuroimaging data and simulated neurodynamical systems are characterized by multiple streams of nonstationarydata • Understanding such signals is not easy because of high volume of data that quickly changes in time • Complex dynamics is usually described in terms of attractors, but precise characterization of their basins and possible transitions between them is never attempted • Various basis set decomposition techniques try to discover components that carry meaningful information which are used to analyze such signals, but these techniques tell us little about the activity of the whole system • Global analysis is needed to see attractors that trap dynamics, characterize the type of system’s behavior, notice partial desynchronization or high frequency noise that blurs the trajectories
Background:Symbolic Dynamics (SD) • The signal space is partitioned into regions labeled with different symbols • Every time the system trajectory is found in one of these regions appropriate symbol is emitted • Sequence of symbols gives a coarse-grained description of dynamics that can be analyzed using statistical tools • Although discretization of continuous dynamical states looses the fluid nature of cognition, symbolic dynamics gives an appropriate framework for cognitive representations (Dale and Spivey, 2005) • Symbols obviously reduce the complexity of dynamical description but partitioning of highly-dimensional signal spaces into regions with sharply defined boundaries is highly artificial
Fuzzy Symbolic Dynamics (FSD) • Fuzzy symbolic dynamics is a natural way to generalize the notion of symbolic dynamics • FSD may be used for dimensionality reduction, defining non-linear mapping for visualization of trajectories that shows various aspects of signals which are difficult to discover looking at individual components, or to notice observing dynamical visualizations • FSD can be applied to raw signals, transformed signals (for example, ICA components), or to signals defined in the time-frequency domain
FSDformulation Trajectory of dynamical system (n-dimensional signal changing in time): Instead of discrete partitioning (like in SD), interesting regions are determined analyzing probability density p(x) of finding the trajectory x(t) in some point x(averaging over time) Local maxima of p(x) define quasi-stable states around which trajectories tend to cluster– they serve as centers μk of prototypes associated with fuzzy membership functions yk(x; μk) that measure the degree to which the x(t) state belongs to the prototype μk. Normalization of vectors in the signal space is assumed (in some cases standardization gives better results)
Example of membership function For visualizationGaussian membershipfunctions are quite useful: Diagonal dispersions Σk are frequently sufficient, suppressing irrelevant signals In general covariance matrices can extract more meaningful combinations of signals that correlate with experimental conditions, or with qualities that may be estimated in a subjective way
Plane and radial waves on a grid A very simple artificial model has been created to understand the structure of complex EEG and similar signals • Sensors are placed on a quadratic grid with nn points • Plane and radial waves are generated by several sources • Waves traveling through the grid create additive patterns and activate these sensors Similar assumptions are made about electric potentials reflecting neuronal activity in the brain, for example in the low resolution electromagnetic tomography, LORETA, http://www.unizh.ch/keyinst/loreta
The grid model The grid has equally spaced points pij = (xi, yj) inside the square: The activation of the sensor due to a plane wave in the grid point pij at time t = 0, 1, 2, . . . is given by: Radial wave reaching the sensor at grid point pij leads to an activation: The final activation of the sensor(sum and normalize all wave values):
Trajectory for one radial wave wave source: (½, ½) | n = 16 | k = 2π | ω = 0.2
Trajectory for two radial waves wave sources: (¼, ¼), (¾, ¾) | n = 16 | k = 2π | ω = 0.2
Neural Respiratory Rhythm Generator model (RRG) • Parametric neural network model; three populations of spiking neurons: beaters (200 in the model), bursters (50) and followers (50) • Reconstructing dynamics of brain stem structures responsible for rhythm generation • The follower population produce an output of the model activity that is used for synaptic excitation of motoneurons and in consequence control of upper and lower lungmuscles • More information: Companion paper: „Models of Respiratory Rhythm Generation in the Pre-BötzingerComplex”, Buteraet. al. 1999 (Laboratory for Neuroenginering, Georgia Tech)
Time series plot for one burst and the corresponding trajectory Clusterizationdone with the k-means algorithm, for two clusters where Gaussian probefunctions have beenplaced
Epileptic EEG data • 100 singlechannelEEG segments of 23.6-sec durationcut out fromcontinuous multichannel EEG recordings after visual inspectionfor artifacts, e.g. due to muscle activity or eye movements • Sampling rate of the data was 173.61 Hz • The manuscript: Andrzejak RG, Lehnertz K, Rieke C, Mormann F, David P, Elger CE (2001) Indications of nonlinear deterministic and finite dimensional structures in time series of brain electrical activity: Dependence on recording region and brain state, Phys. Rev. E, 64, 061907 http://www.meb.uni-bonn.de/epileptologie/science/physik/eegdata.html
Trajectories forepileptic EEG data 4 different subjects; right – epileptic patients; left – control
Conclusions • Symbolic dynamics has found many applications,while its fuzzy version has never beendeveloped • It seems to be a very interesting method that should find many applications • Many aspects of dynamics may be analyzed using this technique: • In which part of the signal space the state of the system spends most of its time? • How many attractors can be identified? • What are the properties of basins of attractors (size, depths)? • What are the probabilities of transition between them? • What type of oscillations occur around the attractors?
Furtherwork • Introduction of quantitative measures to compare different dynamical systems,for example: • the number of attractors • percentage of time spent by the system in a given attractor basin • character of oscillations around attractors, including some measures of chaos • distances between attractors, measured by the time of transitions • probabilities of system transitions between attractors • Methods of parameter adaptation that include context will soon be appliedto visualization of real experimental data • The great challenge is to find quantitativemeasures of the FSD representationsthat would be useful in brain computer interfaces
Thank youfor attention Contact:kdobosz@mat.umk.pl