Download
1 / 36
360 likes | 487 Views
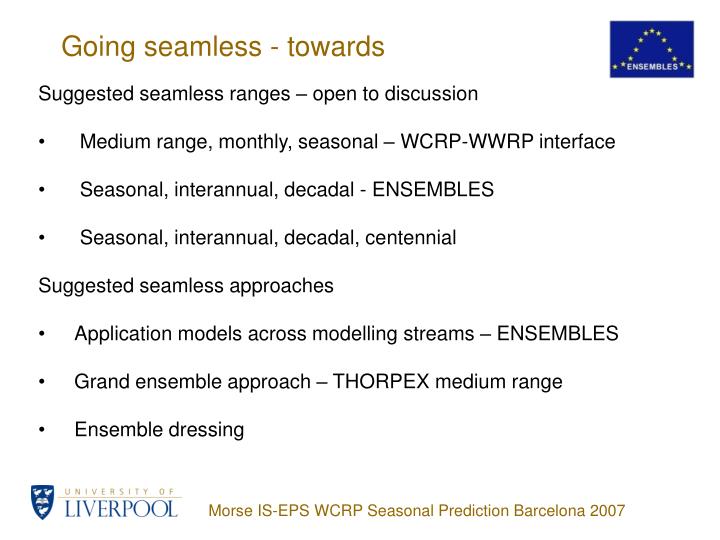
Going seamless - towards. Suggested seamless ranges – open to discussion Medium range, monthly, seasonal – WCRP-WWRP interface Seasonal, interannual, decadal - ENSEMBLES Seasonal, interannual, decadal, centennial Suggested seamless approaches

E N D
Going seamless - towards • Suggested seamless ranges – open to discussion • Medium range, monthly, seasonal – WCRP-WWRP interface • Seasonal, interannual, decadal - ENSEMBLES • Seasonal, interannual, decadal, centennial • Suggested seamless approaches • Application models across modelling streams – ENSEMBLES • Grand ensemble approach – THORPEX medium range • Ensemble dressing Morse IS-EPS WCRP Seasonal Prediction Barcelona 2007
RT6 Assessments and Impacts of Climate Change 24 partners plus affiliated partners • WP6.1 Global changes in biophysical and biogeochemical processes – integrated analysis of impacts and feedbacks • - ACC GCM - Colin Prentice - UNIBRIS, UREADMM, PIK, ULUND, METO-HC, CNRS-IPSL • WP6.2 Linking impact models to probabilistic scenarios of climate change • RCM – Tim Carter – SYKE,DIAS, DISAT, FMI, FUB, NOA, PAS, SMHI, UEA, ULUND, UNIK, UREADMM • WP6.3 - Impact modelling at seasonal to decadal timescales • - s2d – Andy Morse - UNILIV, UREADMM, ARPA-SIM, JRC-IPSC, METEOSWISS, LSE, IRI, EDF, DWD ENSEMBLES GA 2006 Lund RT6 Plenary
RT6 Assessments and Impacts of Climate Change • The three WPs – method and model refinement and application and impact model runs with existing climate model data e.g. DEMETER, AR4 etc. And publishing papers. • Partners working within or towards a probabilistic framework. • Range of application models – some themes through all WPs e.g. crops and > 1 WP e.g. fire, wind damage • Tasks on going – and ready to move to ENSEMBLES data streams – Stream 1 - s2d and ACC and, RCM as available ENSEMBLES GA 2006 Lund RT6 Plenary
ERA 95 85 65 35 15 5 Role of users – malaria plumes Botswana malaria forecast for February 1989, LMM driven by DEMETER multi-model (ERA-driven model shown in red) All plots unpublished Anne Jones, University of Liverpool • November 1997 start • Improvement in skill due to temperature correction • If temperatures too low, delay in model is increased Morse IS-EPS WCRP Seasonal Prediction Barcelona 2007
Tier-3 ROC Areasfor November malaria forecast ROC Area (<0.5 = no skill), Upper Tercile event, forecast 6 month totals for Botswana grid average, () 95% confidence intervals calculated from 1000 bootstrap samples Validated against Thomson et al (2005) Malaria Index
Effect of rainfall bias correction ECMWF Forecast User Group Meeting, June 2006 anne.jones@liv.ac.uk Tier-1 ROC Areas for November rainfall forecast • Bias correction of rainfall causes decrease in skill ROC Area (<0.5 = no skill),forecast 6 month totals for Botswana grid average, () 95% confidence intervals calculated from 1000 bootstrap samples Validated against ERA-40 rainfall totals
ERA 95 85 65 35 15 5 ECMWF Forecast User Group Meeting, June 2006 anne.jones@liv.ac.uk Effect of temperature bias correction Uncorrected Temperature Corrected Temperature DEMETER temperature forecasts for Botswana, November 1997 • Temperature variability not a strong driver of malaria variability in this region • However malaria model requires realistic temperatures • DEMETER temperatures need to be bias corrected to achieve this, because models is sensitive to biases in uncorrected data of ~ 2 degrees
Tier-3 ROC Areas-alternative model outputs • Skill improved by using model mosquito numbers • Bias correction decreases skill due to strong rainfall driver • Cannot use in other areas where temperature a stronger driver ROC Area (<0.5 = no skill), Upper Tercile event, November forecast 6 month totals for Botswana grid average, () 95% confidence intervals calculated from 1000 bootstrap samples Validated against Thomson et al (2005) Malaria Index
ECMWF Forecast User Group Meeting, June 2006 anne.jones@liv.ac.uk Conclusions – Botswana LMM dynamic • DEMETER-driven forecasts were skilful, better than climatology and persistence forecasts • Bias correction of temperature is important even if variability in temperature not important - temperatures must be "realistic" for the application model • Bias correction of rainfall is unsatisfactory - use of daily rainfall output is problematic and need to consider other methods using monthly anomalies instead (e.g. weather generator) • Lag in model mean malaria cases may occur outside forecast window - can be solved for Botswana using mosquito model but not applicable to other areas
Role of users - Statistical Model Malaria PDFs The probability distribution functions of predicted standardized log malaria annual incidence for the years 1992 (anomalously low incidence, left) and 1993 (anomalously high incidence, right) computed with the DEMETER multi-model ensemble forecast system are depicted in red. Observations Botswana Ministry of health in blue from M.C. Thomson, F.J. Doblas-Reyes, S.J. Mason, R. Hagedorn, S.J. Connor, T. Phindela, A.P. Morse, and T.N. Palmer (2006). Malaria early warnings based on seasonal climate forecasts from multi-model ensembles, Nature,439, 576-579. Morse IS-EPS WCRP Seasonal Prediction Barcelona 2007
Role of users - Tanzania statistical malaria model Jones et al. 2007 Fig 5d (submitted) Statistical model ‘C3’ driven by Feb-Jul DEMETER pptn and Aug-Jan. Tmx ob. Giving box-whisker malaria prediction Apr-Sep – obs. driven control, obs. malaria - all standardised anomalies. Morse IS-EPS WCRP Seasonal Prediction Barcelona 2007
kg/ha 12000 10000 8000 6000 4000 2000 0 1977 1978 1979 1980 1981 1982 1983 1984 1985 1986 1987 years Percentile yields (5, 10, 25, 50, 75, 90, 95) obtained using weather data from Cadriano up to the end of April and downscaled Demeter output up to harvest date. Observed yields Yields simulated only with weather data from Cadriano RT6 WP6.3 Impact modelling at seasonal to decadal timescales Regional crop yield forecasting To develop tier-3 validation systems. Dynamic crop model run with 72 downscaled Demeter hindcast members. Comparison with local field data showed interesting skill in forecasting yield two months before harvest. Vittorio Marletto ENSEMBLES GA 2006 Lund RT6 Plenary
RT6 WP5.5 Impacts of mean temperature rise and extreme temperature events on crop yield The relative importance of mean and extremes of temperature was examined on crop yield (Task 5.5.x). Response varied geographically, and depended upon the parameterised response of the crop. Yields were particularly threatened when the reproductive temperature threshold was exceeded, but not the development rate threshold. Boxplots of the percentage change in yield, between the baseline and projection climates for groundnut. ‘S’ and ‘T’ refer to sensitive and tolerant genotypes ; Topt is 28 or 36 oC; ‘OF’ without high temperature stress; ‘ON’ with high temperature stress. Andrew Challinor, Tom Osborne, Tim Wheeler ENSEMBLES GA 2006 Lund RT6 Plenary
RT6 WP6.3 Impact modelling at seasonal to decadal timescales PreWiStor: Wind storm risk and prediction Contribution to D2B.12 ERA40 wind storm Calibrated wind storm Calibration of ERA40 and S2d data to be compatible with Swiss Re wind storms Preliminary methods over calibrate the wind gust Unreliable calibrations are masked in white Paul Della-Marta et al. ENSEMBLES GA Lund RT6 Plenary
Going seamless - towards • Suggested seamless ranges – open to discussion • Medium range, monthly, seasonal – WCRP-WWRP interface • Seasonal, interannual, decadal - ENSEMBLES • Seasonal, interannual, decadal, centennial • Suggested seamless approaches • Application models across modelling streams – ENSEMBLES • Grand ensemble approach – THORPEX medium range • Ensemble dressing Morse IS-EPS WCRP Seasonal Prediction Barcelona 2007
R index of “reproducibility” (Stern and Miyakoda, 1995) where sn is the standard deviation of the ensemble members about the ensemble mean and ss is the climatological variability calculated over all ensemble members and years. W. Stern and K. Miyakoda, 1995. Feasibility of Seasonal Forecasts Inferred from Multiple GCM Simulations. Journal of Climate: Vol. 8, No. 5, pp. 1071–1085. “Ratio of variances” used in CEDO BRANKOVIC; T.N. PALMER, 2000. Seasonal skill and predictability of ECMWF PROVOST ensembles. Quarterly Journal of the Royal Meteorological Society, Volume 126, Number 567, July 2000 Part B, pp. 2035-2067(33)
Pan-African R scores Temperature (bias corrected) Rainfall (uncorrected) DEMETER multimodel ensemble, 1980-2001, Feb forecast totals/mean 1-6 no masking for zero and low CoV
Time-averaged R for Botswana Malaria incidence – February forecast Feb 2-4 Feb 2-4 R DEMETER CV 1982-2001 averages of R, malaria incidence for DEMETER multimodel using bias-corrected temperature. Mask ERA<1 case per 100 people per month, CV<0.5
Time-averaged R for Botswana Malaria incidence – November forecast Nov 2-4 Nov 4-6 DEMETER CV R 1982-2001 averages of R, malaria incidence for DEMETER multimodel using bias-corrected temperature. Mask ERA<1 case per 100 people per month, CV<0.5
Distributions of Malaria Incidence for each model and multi-model “Epidemic” grid points, Feb 2-4
Distributions of Malaria Incidence for each model and multi-model “Epidemic” grid points, Nov 4-6
Time-averaged R for Botswana Rainfall – February forecast Feb 2-4 Feb 2-4 R DEMETER CV 1982-2001 averages of R, malaria incidence for DEMETER multimodel using bias-corrected temperature. Mask ERA<1 case per 100 people per month, CV<0.5
Time-averaged R for Botswana Rainfall – November forecast Nov 2-4 Nov 4-6 R DEMETER CV 1982-2001 averages of R, malaria incidence for DEMETER multimodel uncorrected normalised rainfall. Mask from incidence ERA<1 case per 100 people per month, CV<0.5
Distributions of Rainfall for each model and multi-model “Epidemic” grid points, Feb 2-4
Distributions of Rainfall for each model and multi-model “Epidemic” grid points, Nov 4-6
Time-averaged R for Botswana temperature – February forecast Feb 2-4 Feb 2-4 R DEMETER CV 1982-2001 averages of R, malaria incidence for DEMETER multimodel bias-corrected temperature. Mask from incidence ERA<1 case per 100 people per month, CV<0.5
Time-averaged R for Botswana temperature – November forecast Nov 2-4 Nov 4-6 R DEMETER CV 1982-2001 averages of R, malaria incidence for DEMETER multimodel bias-corrected temperature. Mask from incidence ERA<1 case per 100 people per month, CV<0.5
Distributions of temperature for each model and multi-model “Epidemic” grid points, Feb 2-4
Distributions of temperature (bias-corrected) for each model and multi-model “Epidemic” grid points, Nov 4-6
Role of users –MARA transmission map original ERA Based on model Craig et al. 1999 www.mara.org.za run with climatology and observations and ERA-40 Morse IS-EPS WCRP Seasonal Prediction Barcelona 2007
MARA limiting variable (Tmin is min of 4 daily values) 5 degree –ve offset MARA map (Craig et al, 1999) MARA run with ERA-40 1 deg (1958-2001) Rain Tmean Tmin Botswana malaria slide from Anne Jones, University of Liverpool Morse IS-EPS WCRP Seasonal Prediction Barcelona 2007