Download
1 / 4
40 likes | 266 Views
A. B. Supplimental figure 1. Melanoma free survival curve (A) and summary table (B) for median survival and melanoma free survival for each genotype. All of them are Ink/Arf-/-. C. A. B. EV. Sh4. Sh11. PTEN. AL4. ECAD. NCAD. pAKT. pERK. EV. Sh4. Sh11. -. pFAK. Pten. pSTAT.

E N D
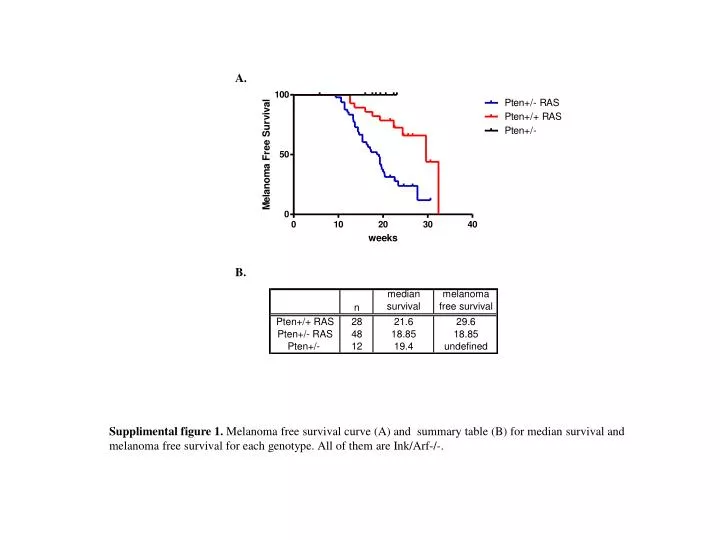
A. B. Supplimental figure 1. Melanoma free survival curve (A) and summary table (B) for median survival and melanoma free survival for each genotype. All of them are Ink/Arf-/-.
C. A. B. EV Sh4 Sh11 PTEN AL4 ECAD NCAD pAKT pERK EV Sh4 Sh11 - pFAK Pten pSTAT ECAD Cyclin D1 R15 Actin Supplimental figure 2. AL4 melanoma cell (RAS-Ink4a/Arf) shows increased invasion (A, top: quantitation, bottom: images) when Pten expression is downregulated with shRNA targeting Pten, which correlates with decreased E-Cadherin expression both at the protein level analyzed by western blot (B) and mRNA level addressed by semi-quantitative rt-PCR analysis (C).
Sh 4 EV AKT IP: Pan 1 2 3 Pan 1 2 3 P-AKT WB: AKT A. B. Ratio of pAKT/AKT in AL4 with Sh4 vs. EV Supplemental Figure 3. Loss of Pten expression with Sh4 in AL4 melanoma cell caused increased AKT2 phosphorylation compared to control with EV. (A) AKT (Pan), AKT1, AKT2, and AKT3 was immunoprecipitated with each antibodies (all except for AKT3 (Upstate) was from Cell signaling technology) and was blotted with p-AKT antibody and then with Akt antibody. (B) Quantitation by ImageJ showed 1.9 fold increase of active AKT2 (pAKT2/AKT2 immunoprecipitated) in cells with Sh4 compared to cells with EV.
CN44 A. B. CN116 myrAKT3 Ctrl PTEN pAKT pSTAT Invasion (106 pixels/well) AKT2 pFAK Actin Ctrl Ponceau myrAKT3 GFP dnAKT2 Supplemental figure 4. (A) Further increase of AKT3 activity in CN116 cells by ectopic expression of myristoylated AKT3 can not enhance invasion compared to empty vector control. pBabe-puro-myr-HA-AKT3 (Addgene Plasmid # 9019) were provided by Dr. William Sellers. (B) Dominant negative AKT2 expression in CN44 cells decreases invasion compared to control cells expressing GFP protein.