Download
1 / 224
2.24k likes | 2.25k Views
This graph displays the percentage of high school students in West Virginia who rarely or never wore a bicycle helmet and seat belt, rode with a driver who had been drinking alcohol, and drove when drinking alcohol or texting/emailing while driving. The data is categorized by sex, grade, and race/ethnicity. The trends from 1993 to 2015 are analyzed using logistic regression models.

E N D
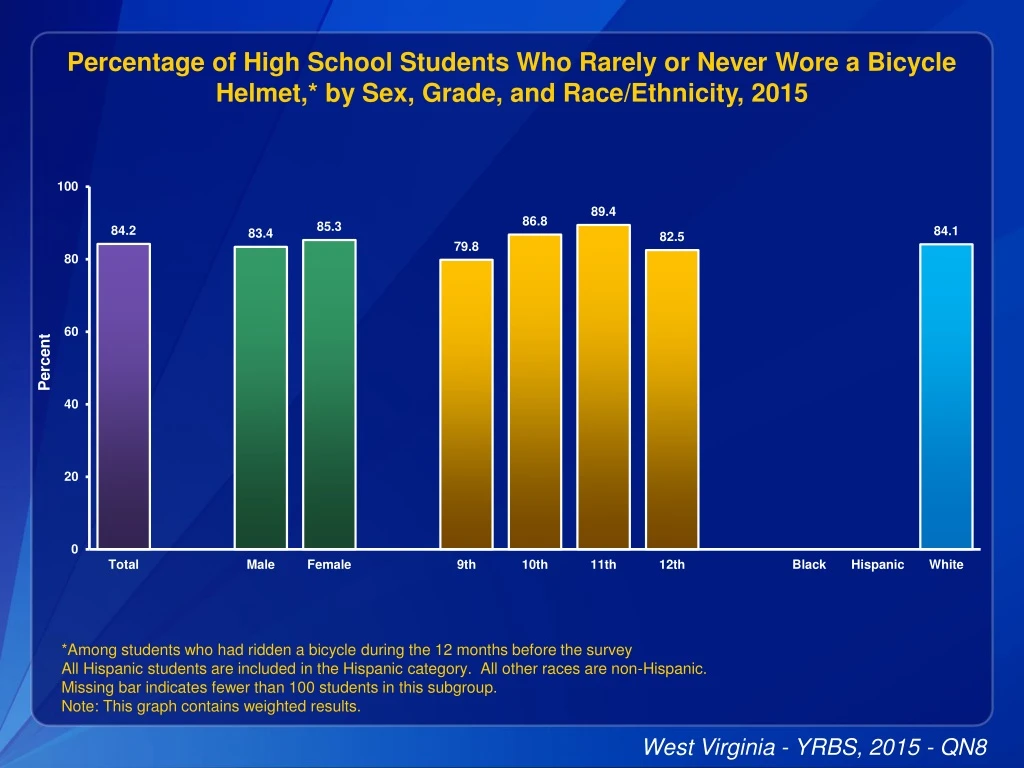
Percentage of High School Students Who Rarely or Never Wore a Bicycle Helmet,* by Sex, Grade, and Race/Ethnicity, 2015 *Among students who had ridden a bicycle during the 12 months before the survey All Hispanic students are included in the Hispanic category. All other races are non-Hispanic. Missing bar indicates fewer than 100 students in this subgroup. Note: This graph contains weighted results. West Virginia - YRBS, 2015 - QN8
Percentage of High School Students Who Rarely or Never Wore a Bicycle Helmet,* 1993-2015† *Among students who had ridden a bicycle during the 12 months before the survey †Decreased 1993-2015, decreased 1993-2003, no change 2003-2015 [Based on linear and quadratic trend analyses using logistic regression models controlling for sex, race/ethnicity, and grade (p < 0.05). Significant linear trends (if present) across all available years are described first followed by linear changes in each segment of significant quadratic trends (if present).] Question not included in the survey in 2001. Note: This graph contains weighted results. West Virginia - YRBS, 1993-2015 - QN8
Percentage of High School Students Who Rarely or Never Wore a Seat Belt,* by Sex,† Grade,† and Race/Ethnicity, 2015 *When riding in a car driven by someone else †M > F; 12th > 11th (Based on t-test analysis, p < 0.05.) All Hispanic students are included in the Hispanic category. All other races are non-Hispanic. Missing bar indicates fewer than 100 students in this subgroup. Note: This graph contains weighted results. West Virginia - YRBS, 2015 - QN9
Percentage of High School Students Who Rarely or Never Wore a Seat Belt,* 1993-2015† *When riding in a car driven by someone else †Decreased 1993-2015, decreased 1993-1997, decreased 1997-2015 [Based on linear and quadratic trend analyses using logistic regression models controlling for sex, race/ethnicity, and grade (p < 0.05). Significant linear trends (if present) across all available years are described first followed by linear changes in each segment of significant quadratic trends (if present).] Question not included in the survey in 2001. Note: This graph contains weighted results. West Virginia - YRBS, 1993-2015 - QN9
Percentage of High School Students Who Rode with a Driver Who Had Been Drinking Alcohol,* by Sex, Grade, and Race/Ethnicity, 2015 *In a car or other vehicle one or more times during the 30 days before the survey All Hispanic students are included in the Hispanic category. All other races are non-Hispanic. Missing bar indicates fewer than 100 students in this subgroup. Note: This graph contains weighted results. West Virginia - YRBS, 2015 - QN10
Percentage of High School Students Who Rode with a Driver Who Had Been Drinking Alcohol,* 1993-2015† *In a car or other vehicle one or more times during the 30 days before the survey †Decreased 1993-2015 [Based on linear and quadratic trend analyses using logistic regression models controlling for sex, race/ethnicity, and grade (p < 0.05). Significant linear trends (if present) across all available years are described first followed by linear changes in each segment of significant quadratic trends (if present).] Question not included in the survey in 2001. Note: This graph contains weighted results. West Virginia - YRBS, 1993-2015 - QN10
Percentage of High School Students Who Drove When Drinking Alcohol,* by Sex, Grade, and Race/Ethnicity, 2015 *One or more times during the 30 days before the survey, among students who had driven a car or other vehicle during the 30 days before the survey All Hispanic students are included in the Hispanic category. All other races are non-Hispanic. Missing bar indicates fewer than 100 students in this subgroup. Note: This graph contains weighted results. West Virginia - YRBS, 2015 - QN11
Percentage of High School Students Who Drove When Drinking Alcohol,* 2013-2015† *One or more times during the 30 days before the survey, among students who had driven a car or other vehicle during the 30 days before the survey †No change 2013-2015 [Based on linear trend analyses using logistic regression models controlling for sex, race/ethnicity, and grade (p < 0.05).] Note: This graph contains weighted results. West Virginia - YRBS, 2013-2015 - QN11
Percentage of High School Students Who Texted or E-Mailed While Driving a Car or Other Vehicle,* by Sex, Grade,† and Race/Ethnicity, 2015 *On at least 1 day during the 30 days before the survey, among students who had driven a car or other vehicle during the 30 days before the survey †10th > 9th, 11th > 9th, 11th > 10th, 12th > 9th, 12th > 10th (Based on t-test analysis, p < 0.05.) All Hispanic students are included in the Hispanic category. All other races are non-Hispanic. Missing bar indicates fewer than 100 students in this subgroup. Note: This graph contains weighted results. West Virginia - YRBS, 2015 - QN12
Percentage of High School Students Who Texted or E-Mailed While Driving a Car or Other Vehicle,* 2013-2015† *On at least 1 day during the 30 days before the survey, among students who had driven a car or other vehicle during the 30 days before the survey †No change 2013-2015 [Based on linear trend analyses using logistic regression models controlling for sex, race/ethnicity, and grade (p < 0.05).] Note: This graph contains weighted results. West Virginia - YRBS, 2013-2015 - QN12
Percentage of High School Students Who Carried a Weapon,* by Sex,† Grade, and Race/Ethnicity, 2015 *Such as a gun, knife, or club on at least 1 day during the 30 days before the survey †M > F (Based on t-test analysis, p < 0.05.) All Hispanic students are included in the Hispanic category. All other races are non-Hispanic. Missing bar indicates fewer than 100 students in this subgroup. Note: This graph contains weighted results. West Virginia - YRBS, 2015 - QN13
Percentage of High School Students Who Carried a Weapon,* 1993-2015† *Such as a gun, knife, or club on at least 1 day during the 30 days before the survey †Decreased 1993-2015, decreased 1993-2003, increased 2003-2015 [Based on linear and quadratic trend analyses using logistic regression models controlling for sex, race/ethnicity, and grade (p < 0.05). Significant linear trends (if present) across all available years are described first followed by linear changes in each segment of significant quadratic trends (if present).] Question not included in the survey in 2001. Note: This graph contains weighted results. West Virginia - YRBS, 1993-2015 - QN13
Percentage of High School Students Who Carried a Gun,* by Sex,† Grade,† and Race/Ethnicity, 2015 *On at least 1 day during the 30 days before the survey †M > F; 10th > 9th (Based on t-test analysis, p < 0.05.) All Hispanic students are included in the Hispanic category. All other races are non-Hispanic. Missing bar indicates fewer than 100 students in this subgroup. Note: This graph contains weighted results. West Virginia - YRBS, 2015 - QN14
Percentage of High School Students Who Carried a Gun,* 1993-2015† *On at least 1 day during the 30 days before the survey †Decreased 1993-2015, decreased 1993-1999, no change 1999-2015 [Based on linear and quadratic trend analyses using logistic regression models controlling for sex, race/ethnicity, and grade (p < 0.05). Significant linear trends (if present) across all available years are described first followed by linear changes in each segment of significant quadratic trends (if present).] Question not included in the survey in 2001. Note: This graph contains weighted results. West Virginia - YRBS, 1993-2015 - QN14
Percentage of High School Students Who Carried a Weapon on School Property,* by Sex,† Grade, and Race/Ethnicity, 2015 *Such as a gun, knife, or club on at least 1 day during the 30 days before the survey †M > F (Based on t-test analysis, p < 0.05.) All Hispanic students are included in the Hispanic category. All other races are non-Hispanic. Missing bar indicates fewer than 100 students in this subgroup. Note: This graph contains weighted results. West Virginia - YRBS, 2015 - QN15
Percentage of High School Students Who Carried a Weapon on School Property,* 1993-2015† *Such as a gun, knife, or club on at least 1 day during the 30 days before the survey †Decreased 1993-2015 [Based on linear and quadratic trend analyses using logistic regression models controlling for sex, race/ethnicity, and grade (p < 0.05). Significant linear trends (if present) across all available years are described first followed by linear changes in each segment of significant quadratic trends (if present).] Question not included in the survey in 2001. Note: This graph contains weighted results. West Virginia - YRBS, 1993-2015 - QN15
Percentage of High School Students Who Did Not Go to School Because They Felt Unsafe at School or on Their Way to or from School,* by Sex, Grade,† and Race/Ethnicity, 2015 *On at least 1 day during the 30 days before the survey †9th > 11th, 10th > 11th (Based on t-test analysis, p < 0.05.) All Hispanic students are included in the Hispanic category. All other races are non-Hispanic. Missing bar indicates fewer than 100 students in this subgroup. Note: This graph contains weighted results. West Virginia - YRBS, 2015 - QN16
Percentage of High School Students Who Did Not Go to School Because They Felt Unsafe at School or on Their Way to or from School,* 1993-2015† *On at least 1 day during the 30 days before the survey †Increased 1993-2015 [Based on linear and quadratic trend analyses using logistic regression models controlling for sex, race/ethnicity, and grade (p < 0.05). Significant linear trends (if present) across all available years are described first followed by linear changes in each segment of significant quadratic trends (if present).] Question not included in the survey in 2001. Note: This graph contains weighted results. West Virginia - YRBS, 1993-2015 - QN16
Percentage of High School Students Who Were Threatened or Injured with a Weapon on School Property,* by Sex, Grade,† and Race/Ethnicity, 2015 *Such as a gun, knife, or club one or more times during the 12 months before the survey †9th > 11th (Based on t-test analysis, p < 0.05.) All Hispanic students are included in the Hispanic category. All other races are non-Hispanic. Missing bar indicates fewer than 100 students in this subgroup. Note: This graph contains weighted results. West Virginia - YRBS, 2015 - QN17
Percentage of High School Students Who Were Threatened or Injured with a Weapon on School Property,* 1993-2015† *Such as a gun, knife, or club one or more times during the 12 months before the survey †Increased, 1993-2007, decreased, 2007-2015 [Based on linear and quadratic trend analyses using logistic regression models controlling for sex, race/ethnicity, and grade (p < 0.05). Significant linear trends (if present) across all available years are described first followed by linear changes in each segment of significant quadratic trends (if present).] Question not included in the survey in 2001. Note: This graph contains weighted results. West Virginia - YRBS, 1993-2015 - QN17
Percentage of High School Students Who Were in a Physical Fight,* by Sex,† Grade,† and Race/Ethnicity, 2015 *One or more times during the 12 months before the survey †M > F; 10th > 12th (Based on t-test analysis, p < 0.05.) All Hispanic students are included in the Hispanic category. All other races are non-Hispanic. Missing bar indicates fewer than 100 students in this subgroup. Note: This graph contains weighted results. West Virginia - YRBS, 2015 - QN18
Percentage of High School Students Who Were in a Physical Fight,* 1993-2015† *One or more times during the 12 months before the survey †Decreased 1993-2015 [Based on linear and quadratic trend analyses using logistic regression models controlling for sex, race/ethnicity, and grade (p < 0.05). Significant linear trends (if present) across all available years are described first followed by linear changes in each segment of significant quadratic trends (if present).] Question not included in the survey in 2001. Note: This graph contains weighted results. West Virginia - YRBS, 1993-2015 - QN18
Percentage of High School Students Who Were Injured in a Physical Fight,* by Sex, Grade,† and Race/Ethnicity, 2015 *One or more times during the 12 months before the survey; injuries had to be treated by a doctor or nurse †9th > 11th (Based on t-test analysis, p < 0.05.) All Hispanic students are included in the Hispanic category. All other races are non-Hispanic. Missing bar indicates fewer than 100 students in this subgroup. Note: This graph contains weighted results. West Virginia - YRBS, 2015 - QN19
Percentage of High School Students Who Were Injured in a Physical Fight,* 1993-2015† *One or more times during the 12 months before the survey; injuries had to be treated by a doctor or nurse †Decreased 1993-2015 [Based on linear and quadratic trend analyses using logistic regression models controlling for sex, race/ethnicity, and grade (p < 0.05). Significant linear trends (if present) across all available years are described first followed by linear changes in each segment of significant quadratic trends (if present).] Question not included in the survey in 2001. Note: This graph contains weighted results. West Virginia - YRBS, 1993-2015 - QN19
Percentage of High School Students Who Were in a Physical Fight on School Property,* by Sex,† Grade, and Race/Ethnicity, 2015 *One or more times during the 12 months before the survey †M > F (Based on t-test analysis, p < 0.05.) All Hispanic students are included in the Hispanic category. All other races are non-Hispanic. Missing bar indicates fewer than 100 students in this subgroup. Note: This graph contains weighted results. West Virginia - YRBS, 2015 - QN20
Percentage of High School Students Who Were in a Physical Fight on School Property,* 1993-2015† *One or more times during the 12 months before the survey †Decreased 1993-2015 [Based on linear and quadratic trend analyses using logistic regression models controlling for sex, race/ethnicity, and grade (p < 0.05). Significant linear trends (if present) across all available years are described first followed by linear changes in each segment of significant quadratic trends (if present).] Question not included in the survey in 2001. Note: This graph contains weighted results. West Virginia - YRBS, 1993-2015 - QN20
Percentage of High School Students Who Were Ever Physically Forced to Have Sexual Intercourse,* by Sex,† Grade,† and Race/Ethnicity, 2015 *When they did not want to †F > M; 11th > 9th (Based on t-test analysis, p < 0.05.) All Hispanic students are included in the Hispanic category. All other races are non-Hispanic. Missing bar indicates fewer than 100 students in this subgroup. Note: This graph contains weighted results. West Virginia - YRBS, 2015 - QN21
Percentage of High School Students Who Were Ever Physically Forced to Have Sexual Intercourse,* 2003-2015† *When they did not want to †No change 2003-2015 [Based on linear and quadratic trend analyses using logistic regression models controlling for sex, race/ethnicity, and grade (p < 0.05). Significant linear trends (if present) across all available years are described first followed by linear changes in each segment of significant quadratic trends (if present).] Note: This graph contains weighted results. West Virginia - YRBS, 2003-2015 - QN21
Percentage of High School Students Who Experienced Physical Dating Violence,* by Sex, Grade,† and Race/Ethnicity, 2015 *One or more times during the 12 months before the survey, including being hit, slammed into something, or injured with an object or weapon on purpose by someone they were dating or going out with among students who dated or went out with someone during the 12 months before the survey †10th > 9th, 10th > 11th, 12th > 9th (Based on t-test analysis, p < 0.05.) All Hispanic students are included in the Hispanic category. All other races are non-Hispanic. Missing bar indicates fewer than 100 students in this subgroup. Note: This graph contains weighted results. West Virginia - YRBS, 2015 - QN22
Percentage of High School Students Who Experienced Physical Dating Violence,* 2013-2015† *One or more times during the 12 months before the survey, including being hit, slammed into something, or injured with an object or weapon on purpose by someone they were dating or going out with among students who dated or went out with someone during the 12 months before the survey †No change 2013-2015 [Based on linear trend analyses using logistic regression models controlling for sex, race/ethnicity, and grade (p < 0.05).] Note: This graph contains weighted results. West Virginia - YRBS, 2013-2015 - QN22
Percentage of High School Students Who Experienced Sexual Dating Violence,* by Sex,† Grade, and Race/Ethnicity, 2015 *One or more times during the 12 months before the survey, including kissing, touching, or being physically forced to have sexual intercourse when they did not want to by someone they were dating or going out with among students who dated or went out with someone during the 12 months before the survey †F > M (Based on t-test analysis, p < 0.05.) All Hispanic students are included in the Hispanic category. All other races are non-Hispanic. Missing bar indicates fewer than 100 students in this subgroup. Note: This graph contains weighted results. West Virginia - YRBS, 2015 - QN23
Percentage of High School Students Who Experienced Sexual Dating Violence,* 2013-2015† *One or more times during the 12 months before the survey, including kissing, touching, or being physically forced to have sexual intercourse when they did not want to by someone they were dating or going out with among students who dated or went out with someone during the 12 months before the survey †No change 2013-2015 [Based on linear trend analyses using logistic regression models controlling for sex, race/ethnicity, and grade (p < 0.05).] Note: This graph contains weighted results. West Virginia - YRBS, 2013-2015 - QN23
Percentage of High School Students Who Were Bullied on School Property,* by Sex,† Grade,† and Race/Ethnicity, 2015 *During the 12 months before the survey †F > M; 9th > 11th, 10th > 11th, 10th > 12th (Based on t-test analysis, p < 0.05.) All Hispanic students are included in the Hispanic category. All other races are non-Hispanic. Missing bar indicates fewer than 100 students in this subgroup. Note: This graph contains weighted results. West Virginia - YRBS, 2015 - QN24
Percentage of High School Students Who Were Bullied on School Property,* 2009-2015† *During the 12 months before the survey †No change 2009-2015 [Based on linear trend analyses using logistic regression models controlling for sex, race/ethnicity, and grade (p < 0.05).] Note: This graph contains weighted results. West Virginia - YRBS, 2009-2015 - QN24
Percentage of High School Students Who Were Electronically Bullied,* by Sex,† Grade,† and Race/Ethnicity, 2015 *Including being bullied through e-mail, chat rooms, instant messaging, websites, or texting during the 12 months before the survey †F > M; 10th > 11th (Based on t-test analysis, p < 0.05.) All Hispanic students are included in the Hispanic category. All other races are non-Hispanic. Missing bar indicates fewer than 100 students in this subgroup. Note: This graph contains weighted results. West Virginia - YRBS, 2015 - QN25
Percentage of High School Students Who Were Electronically Bullied,* 2011-2015† *Including being bullied through e-mail, chat rooms, instant messaging, websites, or texting during the 12 months before the survey †Increased 2011-2015 [Based on linear trend analyses using logistic regression models controlling for sex, race/ethnicity, and grade (p < 0.05).] Note: This graph contains weighted results. West Virginia - YRBS, 2011-2015 - QN25
Percentage of High School Students Who Felt Sad or Hopeless,* by Sex,† Grade, and Race/Ethnicity, 2015 *Almost every day for 2 or more weeks in a row so that they stopped doing some usual activities during the 12 months before the survey †F > M (Based on t-test analysis, p < 0.05.) All Hispanic students are included in the Hispanic category. All other races are non-Hispanic. Missing bar indicates fewer than 100 students in this subgroup. Note: This graph contains weighted results. West Virginia - YRBS, 2015 - QN26
Percentage of High School Students Who Felt Sad or Hopeless,* 1999-2015† *Almost every day for 2 or more weeks in a row so that they stopped doing some usual activities during the 12 months before the survey †No change 1999-2015 [Based on linear and quadratic trend analyses using logistic regression models controlling for sex, race/ethnicity, and grade (p < 0.05). Significant linear trends (if present) across all available years are described first followed by linear changes in each segment of significant quadratic trends (if present).] Question not included in the survey in 2001. Note: This graph contains weighted results. West Virginia - YRBS, 1999-2015 - QN26
Percentage of High School Students Who Seriously Considered Attempting Suicide,* by Sex,† Grade, and Race/Ethnicity, 2015 *During the 12 months before the survey †F > M (Based on t-test analysis, p < 0.05.) All Hispanic students are included in the Hispanic category. All other races are non-Hispanic. Missing bar indicates fewer than 100 students in this subgroup. Note: This graph contains weighted results. West Virginia - YRBS, 2015 - QN27
Percentage of High School Students Who Seriously Considered Attempting Suicide,* 1993-2015† *During the 12 months before the survey †Decreased 1993-2015, decreased 1993-2011, increased 2011-2015 [Based on linear and quadratic trend analyses using logistic regression models controlling for sex, race/ethnicity, and grade (p < 0.05). Significant linear trends (if present) across all available years are described first followed by linear changes in each segment of significant quadratic trends (if present).] Question not included in the survey in 2001. Note: This graph contains weighted results. West Virginia - YRBS, 1993-2015 - QN27
Percentage of High School Students Who Made a Plan About How They Would Attempt Suicide,* by Sex,† Grade,† and Race/Ethnicity, 2015 *During the 12 months before the survey †F > M; 10th > 11th (Based on t-test analysis, p < 0.05.) All Hispanic students are included in the Hispanic category. All other races are non-Hispanic. Missing bar indicates fewer than 100 students in this subgroup. Note: This graph contains weighted results. West Virginia - YRBS, 2015 - QN28
Percentage of High School Students Who Made a Plan About How They Would Attempt Suicide,* 1993-2015† *During the 12 months before the survey †Decreased 1993-2015, decreased 1993-2011, increased 2011-2015 [Based on linear and quadratic trend analyses using logistic regression models controlling for sex, race/ethnicity, and grade (p < 0.05). Significant linear trends (if present) across all available years are described first followed by linear changes in each segment of significant quadratic trends (if present).] Question not included in the survey in 2001. Note: This graph contains weighted results. West Virginia - YRBS, 1993-2015 - QN28
Percentage of High School Students Who Attempted Suicide,* by Sex, Grade,† and Race/Ethnicity, 2015 *One or more times during the 12 months before the survey †9th > 11th, 10th > 11th (Based on t-test analysis, p < 0.05.) All Hispanic students are included in the Hispanic category. All other races are non-Hispanic. Missing bar indicates fewer than 100 students in this subgroup. Note: This graph contains weighted results. West Virginia - YRBS, 2015 - QN29
Percentage of High School Students Who Attempted Suicide,* 1993-2015† *One or more times during the 12 months before the survey †Decreased 1993-2015 [Based on linear and quadratic trend analyses using logistic regression models controlling for sex, race/ethnicity, and grade (p < 0.05). Significant linear trends (if present) across all available years are described first followed by linear changes in each segment of significant quadratic trends (if present).] Question not included in the survey in 2001. Note: This graph contains weighted results. West Virginia - YRBS, 1993-2015 - QN29
Percentage of High School Students Who Attempted Suicide That Resulted in an Injury, Poisoning, or Overdose That Had to Be Treated by a Doctor or Nurse,* by Sex, Grade, and Race/Ethnicity, 2015 *During the 12 months before the survey All Hispanic students are included in the Hispanic category. All other races are non-Hispanic. Missing bar indicates fewer than 100 students in this subgroup. Note: This graph contains weighted results. West Virginia - YRBS, 2015 - QN30
Percentage of High School Students Who Attempted Suicide That Resulted in an Injury, Poisoning, or Overdose That Had to Be Treated by a Doctor or Nurse,* 1993-2015† *During the 12 months before the survey †No change 1993-2015 [Based on linear and quadratic trend analyses using logistic regression models controlling for sex, race/ethnicity, and grade (p < 0.05). Significant linear trends (if present) across all available years are described first followed by linear changes in each segment of significant quadratic trends (if present).] Question not included in the survey in 2001. Note: This graph contains weighted results. West Virginia - YRBS, 1993-2015 - QN30
Percentage of High School Students Who Ever Tried Cigarette Smoking,* by Sex, Grade,† and Race/Ethnicity, 2015 *Even one or two puffs †10th > 9th, 11th > 9th, 12th > 9th (Based on t-test analysis, p < 0.05.) All Hispanic students are included in the Hispanic category. All other races are non-Hispanic. Missing bar indicates fewer than 100 students in this subgroup. Note: This graph contains weighted results. West Virginia - YRBS, 2015 - QN31
Percentage of High School Students Who Ever Tried Cigarette Smoking,* 1993-2015† *Even one or two puffs †Decreased 1993-2015 [Based on linear and quadratic trend analyses using logistic regression models controlling for sex, race/ethnicity, and grade (p < 0.05). Significant linear trends (if present) across all available years are described first followed by linear changes in each segment of significant quadratic trends (if present).] Question not included in the survey in 2001. Note: This graph contains weighted results. West Virginia - YRBS, 1993-2015 - QN31
Percentage of High School Students Who Smoked a Whole Cigarette Before Age 13 Years,* by Sex, Grade,† and Race/Ethnicity, 2015 *For the first time †10th > 9th, 10th > 12th (Based on t-test analysis, p < 0.05.) All Hispanic students are included in the Hispanic category. All other races are non-Hispanic. Missing bar indicates fewer than 100 students in this subgroup. Note: This graph contains weighted results. West Virginia - YRBS, 2015 - QN32
Percentage of High School Students Who Smoked a Whole Cigarette Before Age 13 Years,* 1993-2015† *For the first time †Decreased 1993-2015, no change 1993-2003, decreased 2003-2015 [Based on linear and quadratic trend analyses using logistic regression models controlling for sex, race/ethnicity, and grade (p < 0.05). Significant linear trends (if present) across all available years are described first followed by linear changes in each segment of significant quadratic trends (if present).] Question not included in the survey in 2001. Note: This graph contains weighted results. West Virginia - YRBS, 1993-2015 - QN32