Download
1 / 23
230 likes | 337 Views
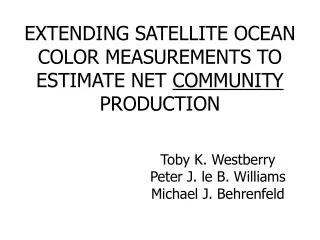
On the small range of annually averaged net community production rates in the open ocean. Michael Bender and Bror Jonsson With support from: Pedro Monteiro and Warren Joubert (CSIR, Stellenbosch)/Agulhas program Bronte Tilbrook (CSIRO, Hobart)/ Astrolabe+Aurora Australis programs

E N D
On the small range of annually averaged net community production rates in the open ocean Michael Bender and BrorJonsson With support from: Pedro Monteiro and Warren Joubert (CSIR, Stellenbosch)/Agulhas program Bronte Tilbrook (CSIRO, Hobart)/Astrolabe+AuroraAustralis programs Matt Reuer, Colorado College (many ship of opportunity cruises) Jan Kaiser (UEA)/Atlantic Meridional Transect program Jan Kaiser and Rachel Stanley (WHOI) (Ka’Imimoana program; Thompson cruise) Nicolas Cassar, SAZ/SENSE and more Many individual cruises and cruise participants
Distribution of carbon export: BGCCSM model (Moore, Doney…)Units: moles m-2 yr-1 • Global sinking POC flux = 6 Gt C/yr at 111 m ~ 10 Gt C/yr at 1% light levelOceanmeasurements indicate less variability
Main points • Wherever measured adequately, NCP and carbon export are ~ 1-5 moles C m-2 year-1 • “Measured adequately” means extensive repeat sampling or survey over a very broad area • The South Pacific subtropical gyre may be exceptionally low • Some speculations on the small range of variability
Background: biological and chemical cycles in the world’s oceans NCP = photosynthesis-respiration Corg is not stored in euphotic zone; NCP ~ export O2 flux to the atmosphere = O2supersat * gas transfer velocity Correct for physical supersaturation based on Arsupersat Sea-air O2 flux = carbon NCP and export CO2+H2O CH2O + O2 Mixed layer Euphotic zone Carbon export
Other sources of NCP and carbon export for this work • 15NO3- assimilation • Seasonal drawdown of DIC or nutrients • Seasonal balance of d13C of CO2 in the upper ocean
Caveats and limitations • In O2/Ar method, O2 fluxes into the oceans assumed due to upwelling • We need to make simple assumptions about seasonality of NCP • We do not distinguish between mixed layer and euphotic zone production • All sources of NCP and carbon export have substantial uncertainties
Net community production in the Southern Ocean • Carbon fluxes from Reuer et al. (2007) (O2/Ar) • Subantarctic zone ~ 4 moles C m-2 year-1 • Polar Frontal Zone ~ 2 moles C m-2 year-1 • Antarctic Zone ~2 moles C m-2 yr-1
Net community production in the equatorial Pacific • Eastern tropical Pacific (5˚S-5˚N, 90˚W – 180) ~ 5 moles C m-2 yr-1 (Aufdenkampe et al., 2001; Dugdale et al., 2011: 15NO3- assimilation) • Western tropical Pacific (3˚N-3˚S, 170˚W – 145˚E) ~ 1.5 moles C m-2 yr-1 (Stanley et al., 2010: O2/Ar)
[NO3-] vs. time: North Atlantic Bloom study, Alkire et al. 2012 Subpolar North Atlantic • Start with 13 µmol/kg NO3- in the top 100 m. Maximum export = 9 moles m-2 • If nutrient drawdown extends to 50 m depth, maximum export = 5 moles m-2 • During the bloom, NCP ~ 1.1 moles m-2 in 3 weeks • Our guess – annually averaged NCP ~ 5 moles C m-2 yr-1 • Quay estimate ~ 3
North Atlantic subtropical gyre at Bermuda • Bermuda: Annual NCP ~ 3 moles m-2 yr-1 • Jenkins, 1988, Stanley et al., 2012…: NO3- and 3He balance • Knapp et al., 2005: 15N flux of N2 fixation • Bates and BATS project: Annual dissolved inorganic carbon drawdown in/below ML Dissolved inorganic carbon, µmol/kg Steinberg et al., 2004
Atlantic Meridional Transect data (Jan Kaiser; O2/Ar measurements) • AMT 16 and 17, boreal spring and fall, 2005 • North Atlantic NCP ~ 1.5 moles m-2 year-1 • South Atlantic NCP ~ 1.0 moles m-2 year-1 Net community production, mmol m-2 day-1
North Pacific subtropical gyre at Hawaii(Emerson et al., 1997) • NCP from O2/Ar~ 2 moles m-2 yr-1 • NCP from DIC balance and d13C balance ~ 2 moles m-2 yr-1 • Sediment traps agree well!
North and South Pacific gyres (Quay et al., 2009; d13C and DIC balance) • NCP was determined by sampling on 9 container ship cruises • Between 20-30 N, NCP ~ 3 moles m-2 yr-1 • Between 20-30 S, 2 moles m-2 yr-1 Net community production (mol m-2 yr-1) vs. latitude
NCP in most major ocean regions • NCP is in the range of 1-4 moles m-2 yr-1 in the • Southern Ocean • Equatorial Pacific Ocean • Subpolar North Atlantic • Subtropical north and south Atllantic • Subtropical North Pacific and western South Pacific • Is NCP much lower in the most oligotropic part of the South Pacific gyre?
Is productivity in the South Pacific subtropical gyre (chl minimum) exceptionally low? (probably yes) • 8 summer ML samples had biological O2supersaturation of 0.1 ± 0.2 µmol/kg (NCP ~ zero) • DIC data shows no significant drawdown in ML, small drawdown in thermocline • Below the mixed layer, NCP ~ 0.3 moles m-2 yr-1
Is productivity in the South Pacific subtropical gyre (chl minimum) exceptionally low? (probably yes) • 8 summer ML samples had biological O2supersaturation of 0.1 ± 0.2 µmol/kg (NCP ~ zero) • DIC data shows no significant drawdown in ML, small drawdown in thermocline • Euphotic zone NCP > 0.3 moles m-2 yr-1 CLIVAR P18 data showing DIC uptake and O2 production in the seasonal thermocline CLIVAR P18 data showing no summer DIC uptake
Summary: why isn’t net community production more variable? • Irradiance is not that variable (about a factor of 2 between equator and 60˚) • Low latitude waters have high rates of gross production, low rates of NCP/GPP • High latitude, nutrient rich waters are not that fertile because: • Growing season is short • Iron is frequently limiting • Self shading limits light penetration • Low latitude, nutrient poor waters are relatively fertile because: • Biomass is low, light penetrates deeply • Low nutrient levels inhibit microbial consumption of DOC • Nitrogen fixation alleviates nutrient limitation • Migrating organisms bring nutrients into the euphotic zone of low nutrient waters • Organisms cleave P and maybe N from DOC
Nutrients and light vary in opposite ways Boreal summer NO3- (µmol kg-1) .01 25 Annual mean surface insolation (Watts m-2) 250 125
North Atlantic subtropical gyre at Bermuda • Bermuda: Annual NCP ~ 3 moles m-2 yr-1 • Jenkins, 1988, Stanley et al., 2012…: NO3- and 3He balance • Knapp et al., 2005: 15N flux of N2 fixation • Bates and BATS project: Annual dissolved inorganic carbon drawdown in/below ML Dissolved inorganic carbon, µmol/kg O2supersaturation, µmol/kg Steinberg et al., 2004
Background: biological and chemical cycles in the world’s oceans Wind-mixed layer (0-50 m) Warm, sunlit upper ocean (0-100 m) Sinking Upwelling Mixing Cold, dark, deep ocean (100-4000 m)
Background: biological and chemical cycles in the world’s oceans Wind-mixed layer (0-50 m) Warm, sunlit upper ocean (0-100 m) CO2+H2O CH2O + O2 Carbon export Sinking Upwelling Mixing CH2O + O2 CO2+H2O Cold, dark, deep ocean (100-4000 m)