Download

1 / 150
1.55k likes | 1.84k Views
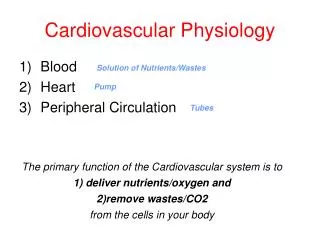
Physiology Cardiovascular System. PreMMed Course 2013 East Coast Basic Science Course. What events occur in the heart each time it beats? How much blood does the heart pump out? What factors affect the amount of blood the heart pumps out?

E N D
PhysiologyCardiovascular System PreMMed Course 2013 East Coast Basic Science Course
What events occur in the heart each time it beats? • How much blood does the heart pump out? • What factors affect the amount of blood the heart pumps out? • How is blood pressure related to blood flow from the heart? • What are the normal cardiovascular response to hypovolaemia? • How do anaesthetics affect the cardiovascular system?
Cardiovascular System Function • Functional components of the cardiovascular system: • Heart • Blood Vessels • Blood • General functions these provide • Transportation • Everything transported by the blood • Regulation • Of the cardiovascular system • Intrinsic & extrinsic • Protection • Against blood loss • Production/Synthesis
Cardiovascular System Function • To create the “pump” we have to examine the Functional Anatomy • Cardiac muscle • Chambers • Valves • Intrinsic Conduction System
Functional Anatomy of the HeartCardiac Muscle • Characteristics • Striated • Short branched cells • Uninucleate • Intercalated discs • T-tubules larger andover z-discs
Cardiac Myocyte Structural Unit:- Sarcomere
Functional Anatomy of the HeartChambers • 4 chambers • 2 Atria • 2 Ventricles • 2 systems • Pulmonary • Systemic
Functional Anatomy of the HeartValves • Function is to prevent backflow • Atrioventricular Valves • Prevent backflow to the atria • Prolapse is prevented by the chordae tendinae • Tensioned by the papillary muscles • Semilunar Valves • Prevent backflow into ventricles
Functional Anatomy of the HeartIntrinsic Conduction System • Consists of “pacemaker” cells and conduction pathways • Coordinate the contraction of the atria and ventricles
Myocardial PhysiologyAutorhythmic Cells (Pacemaker Cells) • Characteristics of Pacemaker Cells • Smaller than contractile cells • Don’t contain many myofibrils • No organized sarcomere structure • do not contribute to the contractile force of the heart conduction myofibers normal contractile myocardial cell SA node cell AV node cells
Myocardial PhysiologyAutorhythmic Cells (Pacemaker Cells) • Characteristics of Pacemaker Cells • Unstable membrane potential • “bottoms out” at -60mV • “drifts upward” to -40mV, forming a pacemaker potential • Myogenic • The upward “drift” allows the membrane to reach threshold potential (-40mV) by itself • This is due to 1. Slow leakage of K+ out & faster leakage Na+ in • Causes slow depolarization • Occurs through If channels (f=funny) that open at negative membrane potentials and start closing as membrane approaches threshold potential 2. Ca2+ channels opening as membrane approaches threshold • At threshold additional Ca2+ ion channels open causing more rapid depolarization • These deactivate shortly after and 3. Slow K+ channels open as membrane depolarizes causing an efflux of K+ and a repolarization of membrane
Myocardial PhysiologyAutorhythmic Cells (Pacemaker Cells) • Characteristics of Pacemaker Cells
Myocardial PhysiologyAutorhythmic Cells (Pacemaker Cells) • Altering Activity of Pacemaker Cells • Sympathetic activity • NE and E increase If channel activity • Binds to β1 adrenergic receptors which activate cAMP and increase If channel open time • Causes more rapid pacemaker potential and faster rate of action potentials Sympathetic Activity Summary: increased chronotropic effectsheart rate increased dromotropic effectsconduction of APs increased inotropic effectscontractility
Myocardial PhysiologyAutorhythmic Cells (Pacemaker Cells) • Altering Activity of Pacemaker Cells • Parasympathetic activity • ACh binds to muscarinic receptors • Increases K+ permeability and decreases Ca2+ permeability = hyperpolarizing the membrane • Longer time to threshold = slower rate of action potentials Parasympathetic Activity Summary: decreased chronotropic effectsheart rate decreased dromotropic effectsconduction of APs decreased inotropic effectscontractility
Myocardial PhysiologyContractile Cells • Special aspects • Intercalated discs • Highly convoluted and interdigitated junctions • Joint adjacent cells with • Desmosomes & fascia adherens • Allow for synticial activity • With gap junctions • More mitochondria than skeletal muscle • Less sarcoplasmic reticulum • Ca2+ also influxes from ECF reducing storage need • Larger t-tubules • Internally branching • Myocardial contractions are graded!
Myocardial PhysiologyContractile Cells • Special aspects • The action potential of a contractile cell • Ca2+ plays a major role again • Action potential is longer in duration than a “normal” action potential due to Ca2+ entry • Phases 4 – resting membrane potential @ -90mV 0 – depolarization • Due to gap junctions or conduction fiber action • Voltage gated Na+ channels open… close at 20mV 1 – temporary repolarization • Open K+ channels allow some K+ to leave the cell 2 – plateau phase • Voltage gated Ca2+ channels are fully open (started during initial depolarization) 3 – repolarization • Ca2+ channels close and K+ permeability increases as slower activated K+ channels open, causing a quick repolarization
Cardiac Myocyte Action Potential Phase 0 – Rapid Depolarisation Phase 1 – Spike Phase 2 – Plateau Phase 3 – Repolarisation Phase 4 – Diastolic potential
Myocardial PhysiologyContractile Cells • Skeletal Action Potential vs Contractile Myocardial Action Potential
Myocardial PhysiologyContractile Cells • Plateau phase prevents summation due to the elongated refractory period • No summation capacity = no tetanus • Which would be fatal
Summary of Action PotentialsSkeletal Muscle vs Cardiac Muscle
Cardiac Cycle • One complete sequence that occur during the contraction (systole) and relaxation (diastole) of the ventricular muscle • This activity is initiated by cardiac action potential
Cardiac CycleCoordinating the activity • Electrical Conduction Pathway
Cardiac CycleCoordinating the activity • The electrical system gives rise to electrical changes (depolarization/repolarization) that is transmitted through isotonic body fluids and is recordable • The ECG! • A recording of electrical activity • Can be mapped to the cardiac cycle
The sum of these action potential is recorded as the ECG P wave – atrial depolarisation PR interval – spread of excitation through the atria, AV node and bundle of His QRS complex – spread of excitation through the ventricles T wave – ventricular repolarisation
Atrial Contraction(A-V Valves Open, Semilunar Valves Closed) • The first phase - initiated by the p wave of ECG - electrical depolarization of the atria. • Atrial depolarization then causes contraction of the atrial musculature. As the atria contract, the pressure within the atrial chambers increases, which forces more blood flow across the open A-V valves, leading to a rapid flow of blood into the ventricles. • Blood does not flow back into the vena cava because of inertial effects of the venous return and because the wave of contraction through the atria moves toward the AV valve thereby having a "milking effect." • Atrial contraction produce a small increase in venous pressure that can be noted as the "a-wave" of the left atrial pressure. Just following the peak of the a wave is the x-descent.
After atrial contraction is complete, the atrial pressure begins to fall causing a pressure gradient reversal across the AV valves. This causes the valves to float upward (pre-position) before closure. At this time, the ventricular volumes are maximal - end-diastolic volume (EDV). • The left ventricular EDV (LVEDV) ~ 120 ml, represents the ventricular preload and is associated with end-diastolic pressures of 8-12 mmHg and 3-6 mmHg in the left and right ventricles, respectively. • A heart sound is sometimes noted during atrial contraction (fourth heart sound, S4). This sound is caused by vibration of the ventricular wall during atrial contraction.
Isovolumetric Contraction(All Valves closed) • This phase of the cardiac cycle begins with the QRS complex of the ECG - ventricular depolarization. • This triggers excitation-contraction coupling, myocyte contraction and a rapid increase in intraventricular pressure. Early in this phase, the rate of pressure development becomes maximal - maximal dP/dt. • The AV valves close as intraventricular pressure > atrial pressure. Ventricular contraction also triggers contraction of the papillary muscles with their attached chordae tendineae that prevent the AV valve leaflets from bulging back into the atria and becoming incompetent . Closure of the AV valves results in the first heart sound (S1)- normally split (~0.04 sec) because MV closure precedes TV
During the time between the closure of the AV valves and the opening of the aortic and pulmonic valves, ventricular pressure rises rapidly without a change in ventricular volume - no ejection occurs. • Ventricular volume does not change because all valves are closed during this phase. Contraction- "isovolumic" or "isovolumetric." • The "c-wave" noted in the LAP may be due to bulging of mitral valve leaflets back into left atrium. Just after the peak of the c wave is the x'-descent.
Rapid Ejection(Aortic and Pulmonic Valves Open; AV Valves Remain Closed) • Initial and rapid ejection of blood into the aorta and pulmonary arteries from the left and right ventricles, respectively. • Ejection begins when the intraventricular pressures > the pressures within the aorta and pulmonary artery, which causes the aortic and pulmonic valves to open. • Ventricular pressure normally > outflow tract pressure by a few mmHg. This pressure gradient across the valve is ordinarily low because of the relatively large valve opening (low resistance). Maximal outflow velocity is reached early in the ejection phase, and maximal (systolic) aortic and pulmonary artery pressures are achieved.
Normally no heart sounds noted during ejection because the opening of healthy valves is silent. The presence of sounds during ejection indicate valve disease or intracardiac shunts. • Left atrial pressure initially decreases as the atrial base is pulled downward, expanding the atrial chamber. Blood continues to flow into the atria from their respective venous inflow tracts and the atrial pressures begin to rise, and continue to rise until the AV valves open at the end of phase 5.
Reduced EjectionAortic and Pulmonic Valves Open; AV Valves Remain Closed • Approximately 200 msec after the QRS and the beginning of ventricular contraction, ventricular repolarization occurs (T-wave of the ECG). • Repolarization leads to a decline in ventricular active tension and therefore the rate of ejection falls. • Ventricular pressure falls slightly below outflow tract pressure; however, outward flow still occurs due to kinetic (inertia) energy of the blood. • Left atrial and right atrial pressures gradually rise due to continued venous return from the lungs and from the systemic circulation, respectively
Isovolumetric RelaxationAll valves closed • When the intraventricular pressures fall sufficiently at the end of phase 4, the aortic and pulmonic valves abruptly close (aortic precedes pulmonic) causing the second heart sound (S2) and the beginning of isovolumetricrelaxation. • Valve closure is associated with a small backflow of blood into the ventricles and a characteristic notch (incisura or dicrotic notch) in the aortic and pulmonary artery pressure tracings. • After valve closure, the aortic and pulmonary artery pressures rise slightly (dicrotic wave) following by a slow decline in pressure. • The rate of pressure decline in the ventricles is determined by the rate of relaxation of the muscle fibers, which is termed lusitropy. This relaxation is regulated largely by the sarcoplasmic reticulum that are responsible for rapidly re-sequestering calcium following contraction.
Although ventricular pressures decrease during this phase, volumes remain constant because all valves are closed. The volume of blood that remains in a ventricle is called the end-systolic volume~ 50 ml in the left ventricle. The difference between the end-diastolic volume and the end-systolic volume is ~70 ml and represents the stroke volume. • Left atrial pressure (LAP) continues to rise because of venous return from the lungs. The peak LAP at the end of this phase is termed the v-wave.
Rapid FillingA-V Valves Open • As the ventricles continue to relax, the intraventricular pressures will at some point fall below their respective atrial pressures. When this occurs, the AV valves rapidly open and ventricular filling begins. • Despite the inflow of blood from the atria, intraventricular pressure continues to briefly fall because the ventricles are still undergoing relaxation. Once the ventricles are completely relaxed, their pressures will slowly rise as they fill with blood from the atria. • The opening of the mitral valve causes a rapid fall in LAP. The peak of the LAP just before the valve opens is the "v-wave." This is followed by the y-descent of the LAP. A similar wave and descent are found in the right atrium and in the jugular vein.
Reduced FillingA-V Valves open • As the ventricles continue to fill with blood and expand, they become less compliant and the intraventricular pressures rise. This reduces the pressure gradient across the AV valves so that the rate of filling falls. • In normal, resting hearts, the ventricle is about 90% filled by the end of this phase. In other words, about 90% of ventricular filling occurs before atrial contraction. • Aortic pressure and pulmonary arterial pressures continue to fall during this period.