Download
1 / 27
270 likes | 278 Views
Galactic Cosmic-Rays Observed by Fermi-LAT (and GRBs) Tsunefumi Mizuno Hiroshima Univ. on behalf of the Fermi-LAT Collaboration GRB Symposium “Deciphering the Ancient Universe” September 26, 2009, Gifu, Japan. Plan of the Talk. Cosmic-ray overview and Fermi Gamma-ray Space Telescope

E N D
Galactic Cosmic-Rays Observed by Fermi-LAT (and GRBs) Tsunefumi Mizuno Hiroshima Univ. on behalf of the Fermi-LAT Collaboration GRB Symposium “Deciphering the Ancient Universe” September 26, 2009, Gifu, Japan
Plan of the Talk Cosmic-ray overview and Fermi Gamma-ray Space Telescope Cosmic-ray electrons seen by Fermi-LAT (nearby CR sources) Galactic CRs revealed by diffuse g-ray emission observed by Fermi-LAT (CRs in distant location)
Introduction:Cosmic-Rays and the Fermi Gamma-ray Space Telescope
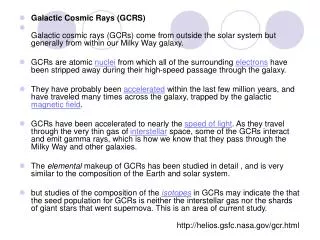
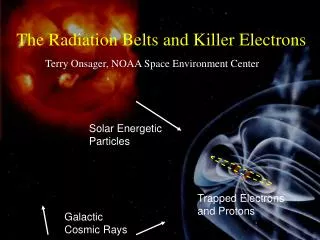
1 particle/m2/sec Flux (m2 sr s GeV)-1 Knee 1 particle /m2/yr Ankle 1 particle/km2/yr Energy (eV) Cosmic-Rays Overview • Discovered by V. Hess in 1912 • Globally power-law spectrum with some structures (knee and ankle) • hint of the origin • E<Eknee are (probably) Galactic origin V. Hess, 1912 • Composition: • e- ~ (1/100 - 1/1000) x p, e+ ~ (1/10) x e- • Large energy density: ~1 eV cm-3 • comparable to UB and Urad • Studied by direct and indirect measurements • GRBs are the possible origin of ultra high-energy CRs. May also affect the Galactic CRs. (e.g., Wick et al. 2004) Galactic G or EG? 直接観測・間接両方の手段 Extragalactic • GRBは、最高エネルギー宇宙線、knee付近の銀河宇宙線の起源として有力 • 宇宙線研究:起源と伝播・分布
Introduction (1):What Can We Learn from HE e-/e+ (and p/p) ? • Inclusive spectra: e- + e+ • Electrons, unlike protons, lose energy rapidly by Synchrotron and Inverse Compton: at very high energy they probe the nearby sources • Charge composition: e+/(e- + e+) and p/(p + p) ratios • e+ and p are produced by the interactions of high-energy cosmic rays with the interstellar matter (secondary production) • There might be signals from additional (astrophysical or exotic) sources • Different measurements provide complementary information of the origin, acceleration and propagation of cosmic rays • All available data must be interpreted in a coherent scenario e- + e+ : 近傍の宇宙線源を探るプローブ Study nearby sources (astrophysical or exotic)
SNR RX J1713-3946 B HESS π 0 e e π gas gas + + + - - - Introduction (2): What Can We Learn from Galactic Diffuse Gamma-Rays? HE g-rays are produced via interactions between Galactic cosmic-rays (CRs) and the interstellar medium (or interstellar radiation field) (CR Accelerator) (Interstellar space) (Observer) ISM X,γ synchrotron Chandra, Suzaku, Radio telescopes IC ISRF P He CNO diffusion energy losses reacceleration convection etc. bremss Pulsar, m-QSO ACTs, Fermi diffuse g : 宇宙線分布を探るプローブ A powerful probe to study CRs (mostly protons) in distant locations
Fermi Gamma-ray Space Telescope • Twoinstruments: • Large Area Telescope (LAT) • 20 MeV - >300 GeV • Gamma-ray Burst Monitor (GBM) • 8 keV - 40 MeV • Fermi-LAT consists of three subsystems • ACD: segmented plastic scintillators • BG rejection • Tracker: Si-strip detectors & W converters • ~1.5 R.L. (vertical) • Identification and direction measurement of g-rays • Calorimeter: hodoscopic CsI scintillators • ~8.5 R.L. (vertical) • Energy measurement • Also serves as an Imaging Calorimeter LAT GBM Ideal for the direct and indirect (through g-ray obs.) measurement of CRs 直接測定(e- + e+)、間接測定(diffuse g)
Quick Review ofPositron and Antiproton Fraction: 2008-09 • PAMELA positron and antiproton • Nature 458, 607 (2009) • PRL 102, 051101 (2009) 1 GeV 10 100 • Antiproton fraction consistent with secondary production • Anomalous rise in the positron fraction above 10 GeV • Several different viable interpretations (>200 papers over the last year) See also Nature 456, 362 (2008) and PRL 101, 261104 (2008) for pre-Fermi CRE spectrum by ATIC and HESS. e+fraction excessは2ndary 起源とは相いれない
FOM for CRE Measurement Exposure factor (effectively) determines the # of counts Ef(E) = Gf(E)*Tobs Fermi-LAT: 最大の統計を誇る L. Baldini (m2 sr) • The exposure factor determines the statistics • Imaging calorimeters (vs. spectrometers) feature larger Gf • Space (vs. balloon) experiments feature longer Tobs Fermi-LAT gives the largest Ef and highest statistucs
Fermi-LAT Capability for CR Electrons BG rejection (E>150 GeV) Energy Resolution • Validate the MC against the beam test up to 280 GeV • Finite energy resolution is taken into account in the spectrum. • compare the flight histogram with the simulated ones, and account for the differences in systematic errors Geometric Factor (Gf) Residual hadron contamination 20 GeV 100 GeV 1 TeV Beam testでMCをverify
Fermi-LAT Electron Spectrum • Abdo et al. Phys. Rev. Let. 102, 181101 (2009) • statistics for 6 month data • >4 million electrons above 20 GeV • >400 electrons in the last energy bin • Harder spectrum (spectral index: -3.04) than previously thought • Pre-Fermi reference model (GALPROP conventional model): ---------- • conventional source distribution (uniformly distributed distant sources) • source PL index: g0=2.54 • diffusion coefficient index: d=0.33 • no ATIC excess • hard spectrum (G ~ 3)
Implication from Fermi-LAT CRE (1) • for detail, see D. Grasso et al. 2009 (Astroparticle Physics, 32, 140) • New “conventional” model • g0=2.42 (d=0.33, w/ reacceleration) • g0=2.33 (d=0.6, plain diffusion) re-Fermi “conventional” CRE Model g0=2.54 New “conventional” CRE models g0=2.42 g0=2.33 • Fermi CRE spectrum can be reproducedby the “conventional” model with harder injection spectral index (-2.42) than in a pre-Fermi conventional model (-2.54), within our current uncertainties both statistical and systematic. パラメタをちょっといじればOK
Implication from Fermi-LAT CRE (2) • Now include recent PAMELA result on positron fraction 2ndary 起源なら必ず右下がりになる=>positron excessはこの反対 New “conventional” CRE models Old “conventional” CRE Model • If the secondary positrons only • e+/(e- + e+) ~ E^(-gP+g0); gP~2.7 (proton spectral index), g0~2.4 • The hard e+ + e- spectrum found by Fermi-LAT sharpens the anomaly
Implication from Fermi-LAT CRE (3) • It is becoming clear that we are dealing with at least 3 distinct origins of HE e-/e+ • Uniformly distributed distant sources, likely SNRs. • Unavoidable e+e- production by CRs and the ISM • And those that create positron excess at high energies. • Nearby (d<1 kpc) and Mature (104 - 106 yr) pulsars (e.g., Grasso+ 09) • Nearby GRB (or GRB-like event) (Ioka 09) • Nearby SNR in dense cloud (e.g., Fujita+ 09) • Dark matter (many including Grasso+ 09) • Klein-Nishina effect (Stawarz+ 09, Schlickeiser+ 09) “conventional” sources • Fermi data requires an e-/e+ injection spectrum significantly harder than generally expected for shell-type SNRs 宇宙線源を直接とらえた? Pulsar, GRB, etc..
Pulsar Scenario • Anexample of the fit to both Fermi and PAMELA data with Monogem and Geminga with a nominal choice for the e+/e- injection parameter (blue lines). • (Discrepancy in positron fraction at low energies can be understood as the charge-sign effect of solar modulation) • This particular model assumes: • 40% e-/e+ conversion efficiency • G=1.7 • Ecut=1 TeV • Delay=60 kyr (Emax=1/bt, b=1.4x10⁻¹⁶ GeV-1 s-1) 適当なパラメタでFermi/PAMELAとも説明可能
GRB Scenario? Ioka 2009 (arXiv: 0812.4851) • model (a) fits to the Fermi and PAMELA data well: • tage = 2x10⁵ yr • Ee+ = 0.9 x 1050 erg • a = 2.5, up to 10TeV • b = 10-16 GeV-1 s-1 • ATIC data can also be explained by a somewhat harder and older GRB-like event • Chance probability of having such a GRB: ~0.6-6 % 近場のGRBでも(Pulsarと同様に)OK
Summary of CRE • Real breakthrough during last 1-1.5 years in CR electrons: ATIC, HESS, PAMELA and finally Fermi-LAT • The hard e-/e+ spectrum by Fermi contradicts with PAMELA’s positron fraction. • We may be coming close to the first detection of cosmic-ray sources • Source nature (astrophysical or exotic) is still unclear but strongly constrained by the data of Fermi-LAT (+ others) • More results from Fermi-LAT are coming. Extending energy range to 5 GeV – 2 TeV and searching for the CRE anisotropy at a level of ~1%. 近場の宇宙線源をとらえた? 異方性がでれば決め手になりうる Ioka 09
Fermi-LAT Result (2): Diffuse Gamma-ray Emission and Galactic CRs
Probing CRs using Gamma-rays • HE gs are generated through pi0-decay (p and ISM), bremsstrahlung (e+e- and ISM) and IC (e+e- and IRF) • CR spectrum can be deduced from the gamma-ray data and the ISM distribution g線 = ISM * 宇宙線 Gamma-ray intensity (Fermi LAT data) ISM (e.g., LAB HI survey) (http://www.astro.uni-bonn.de/~webaiub/english/tools_labsurvey.php) • Mid/high latitude region & Galactic plane: • Study of the local CRs and CR gradient in the outer Galaxy (From Wikipedia) sun GC
Outstanding Question: EGRET GeV Excess |b|=10°-20° EGRET LAT Preliminary Abdo et al. submitted to PRL Porter et al. 2009 (arXiv:0907.0294) 0.1 1 10 GeV • EGRET showed excess emission > 1 GeV everywhere in the sky over the model based on directly measured CRs • a variety of explanations including large CR variation and DM annihilation • |b|=10°-20°: avoid Gal. plane but still have high statistics • LAT spectrum is significantly softer and does not confirm the EGRET GeV excess (G~2.7のPLで落ちてくれない) GeV excessは確認されず
Accurate Measurements of the Local CRs • Mid-high lat. region in 3rd quadrant: • small contamination of IC and molecular gas • correlate g-ray intensity and HI gas column density Abdo et al. 2009 (contact: TM) • Best quality g-ray emissivity spectrum (per H-atom) in 100 MeV-10 GeV (Tp = 1-100 GeV) • Directly measured CR spectrum (LIS) is representative of the local CR spectrum • Not easy to detect the additional e-/e+ signal through gs. (no hadron rejection) LAT data model for the LIS nucleon-nucleon electron-bremsstrahlung 近傍の宇宙陽子線はLISに酷似
CR Distribution in Galaxy • CR distribution is a key to understand their origin and propagation • Distribution of SNRs not well measured • Previous Gamma-ray data suggests a flatter distribution than SNR/pulsar distributions (e.g., Strong et al. 2004) Pulsar distribution (Lorimer 2004) SNR distribution (Case & Bhattacharya 1998) CR source distribution from g-rays (Strong & Mattox 1996) sun 0 5 10 15 kpc • Fermi-LAT is able to map out CR distributions in the Galaxy with unprecedented accuracy • Large scale analysis in progress. (arXiv:0907.0304, arXiv:0907.0312) • Preliminary analysis of the 3rd quadrant (outer Galaxy) will be discussed. Gal. Center Inner Galaxy local arm Outer Galaxy 銀河面拡散g線: 宇宙線の空間分布 Perseus arm
Fermi-LAT View of the 3rd Quadrant • One of the best studied regions in g-rays • Vela, Geminga, Crab and Orion A/B • Galactic plane between Vela and Geminga (green square) is ideal to study diffuse g-rays and CRs. • small point source contamination, kinematically well-separated arms (local arm and Perseus arm) Preliminary Geminga Vela Crab Orion A/B Count Map (E>100 MeV)
Construction of the Model Preliminary • Fit gamma-ray data with a linear combination of model maps • I(E, l, b) = SA(E)*HI(l,b) + SB(E)*Wco(l,b) +Sothers+Spoint_sources • Coefficients give the gamma-ray (CR) spectral distribution of outer Galaxy 拡散g線 =S ISM*宇宙線+a = Local arm Local arm Perseus arm + + + others (ISM, IC and point sources)
HI Emissivity (CR) Spectra HI Emissivity Spectrum of each ring (local arm) (interarm) (Perseus arm) Preliminary Point sources with Ts>=100 are included in the fitting • Emissivity spectrum of local arm (R=8.5-10 kpc) is slightly smaller than the model for LIS • Decreasing emissivity (local arm => interarm => Perseus arm) are interpreted to be du to the decreasing CR density across the Galaxy • Similar CR spectral shape up to R=16 kpc • Can constrain the CR source distribution and propagation parameters • study in progress 銀河宇宙線の分布が明らかになりつつある
Summary • Fermi-LAT is a powerful instrument to measure CRs either directly or indirectly • Fermi-LAT revealed that high-energy e- + e+ spectrum is harder than previously assumed. • this finding + PAMELA positron fraction require local sources (astrophysical or exotic) • nearby GRB is one of possible origins • Source nature is still unclear but strongly constrained. • CRs in distant locations can be “measured” by diffuse g-rays. • EGRET GeV-excess not confirmed. • Fermi proves that local CR nuclei spectra are close to those of LIS. • CR density distribution in outer Galaxy is being studied. 宇宙線電子:近傍の宇宙線源をとらえた? 拡散g線:銀河宇宙線の大局分布が明らかになりつつある Thank you for your attention!