Download
1 / 24
240 likes | 249 Views
Discover the different types of maps and aerial photos, including geopolitical, topographic, and geologic maps. Learn about the common elements found in maps and how GIS software allows for new map types. Explore coordinate systems, scales, legends, and more. This information is essential for understanding and utilizing maps and aerial photos effectively.

E N D
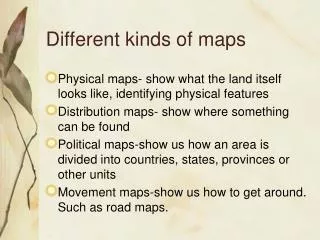
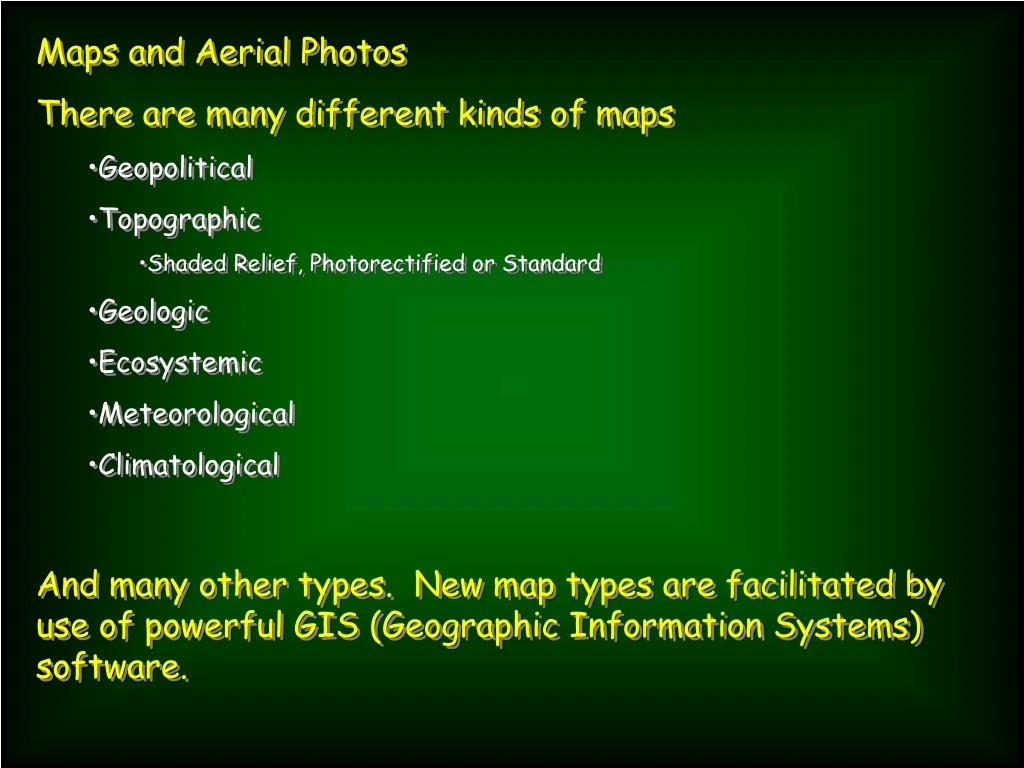
Maps and Aerial Photos • There are many different kinds of maps • Geopolitical • Topographic • Shaded Relief, Photorectified or Standard • Geologic • Ecosystemic • Meteorological • Climatological • And many other types. New map types are facilitated by use of powerful GIS (Geographic Information Systems) software.
Maps and photos • All maps have common elements • Scale • distance on the map equal to distance in the real world • Legend • What the symbols on the map represent • Coordinate system • Latitude Longitude; Township & Range; UTM • Orientation info • Which way is north south east and west
Scales • Verbal- words used to convey map distance / real world distance equivalencies • e.g., one inch equals four thousand feet • Graphic- usually a bar or line with calibration marks that indicate map distance real / world distance equivalencies • Fractional - the numeric UNITLESS ratio of map distance to real world distance equivalencies 1:40,000 Note- NO UNITS until you assign them
Legend- a window that shows all the symbols used on the map. It commonly also includes scale, title, and orientation information
Coordinate Systems Latitude / Longitude- based on 360° circle coordinate system with Equator and Prime meridian as the respective index lines Commonly given as decimal degrees (38.6466° N, 98.3456° W), degrees with decimal minutes (38° 36.32’ N, 98° 18.2’ W) or degrees minutes and seconds (38° 36’ 18” N, 98° 18’ 12” W) Prime meridian North Equator South
Coordinate systems UTM- a coordinate system based on a 1000 meter grid with the center of of each zone as the alignment point of the grid cells UTM coordinates might read 16 S 0455680 E 4268326 N
Coordinate systems Township Range a coordinate system based on a numeric grid
Common Maps used in the geosciences Topographic maps Contour lines represent vertical elevation with reference to sea level (zero elevation) they are isometric lines of what ever they are representing, in our case elevation Contour intervals are 5, 10, 20, 50 or 100 foot intervals Index contours are labeled and thicker Contour lines never cross or touch They “V” when they cross a stream channel, with the point of the “V” in the upstream direction They can create closed shapes on the map can represent either a hill or a depression Frequently used to make topographic profiles
Aerial Photos Frequently need to know the fractional scale on stereo photos Must compare photo area to map of the same area with known scale to determine the scale of the photograph Photo distance (mm) = Real distance as determined from map (Km) Then convert the above numbers to a unitless ratio Photo distance (mm) / Real world distance (mm)
Geological maps Usually indicated by numerous colors used to identify various geological units systems groups formations members Contacts are indicated by lines with varying degrees of certainty by solid or dashed lines Also indicate location of geological structures faults folds intrusions dikes and sills
0° 0°N 270° 90° 90° W 90° E 180° 0°S
Overlaying vector based maps to create derivative maps Color is attribute as is alphabetic designation
Layers of geographic information, which in turn can create new layers of data
Point specific layers Point source pollution Weather stations