Download

1 / 35
350 likes | 356 Views
The US Diet and the Role of Beverage Barry M. Popkin Department of Nutrition, School of Public Health and Medicine The University of North Carolina at Chapel Hill. Outline. Major US dietary trends Beverages and their contribution to energy intake

E N D
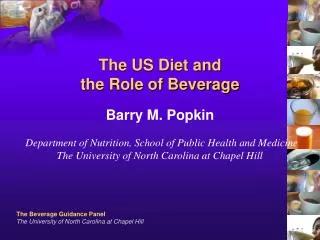
The US Diet and the Role of BeverageBarry M. PopkinDepartment of Nutrition, School of Public Health and MedicineThe University of North Carolina at Chapel Hill
Outline • Major US dietary trends • Beverages and their contribution to energy intake • The beverage panel: how constituted, process, product • The development of a beverage guidance system • Discussion of major beverage groupings • Recommended Beverage patterns
Dietary Patterns in the United States • The number of eating occasions is increasing! • Portion sizes of actual meals consumed is increasing! • Away from home eating continues to increase! • Adult consumption patterns differ on weekends! • The trends toward greater consumption of calorically-sweetened beverages continues!
Why do we care about snacking behaviors? • Snacks have increased in number significantly over time • Snacks are consistently more energy dense and less nutrient dense (calcium, fiber, folate) than meals • Snack portion size: some studies suggest the average size of a snack remains unchanged, others suggest that it has increased • Contribution of daily calories by snacks increased by 30% to approximately 25% of total kcal in 1996
Changes in Major Food Sources of Energy From Snacking: Young Adults Aged 19-29 Total 15.7 Desserts 23.0 Sweetened Beverages 15.7 Regular Soft Drinks Diet Soft Drinks Fruit Drinks 14.3 Alcoholic Beverages 12.5 Beer Liquor Wine 10.0 Milks 5.8 Skim ½% Whole 8.8 Salty SnackFoods 11.5 Low Fat Snack Foods High Snack Foods 5.9 Zizza et al 2001 Prev Med 32:303
Why do we care about portion size? • Food portion sizes appear to be positively related to energy intake in children and adults • Marketplace food portions are consistently larger than in the past • Soft drinks are a leader in increased portion sizes • Energy intake positively associated with non-diet soft drinks in children and adolescents • Trade-offs seen between soft drink intake and milk intake
Portion Sizes for Selected Foods for Individuals Aged 2 and Older, USA 1977-1998 Nielsen & Popkin 2003 JAMA 289:450-453.
Were important trends found in portion sizes between 1977-1998? • Portions increasing for all foods in all locations (except pizza): • Salty Snacks by 93 kcals (0.6 ounces) • Soft Drinks by 49 kcals (6.8 ounces) • Hamburgers by 97 kcals (1.3 ounces) • French Fries by 68 kcals (0.5 ounces) • Mexican Food by 133 kcals (1.7 ounces)
Trends in Total Energy Intake: The Proportion of Energy by Food Source for US Adolescents Aged 12-18 Percentage of total daily kcal Nielsen et. Al. (2002). Obesity Research 10: 370-378.
Trends in Total Energy Intake by Location, 1977- 96 Ages 12-18 Ages 19-29 '77-78 '89-91 '94-96 Nielsen et. Al. (2002). Obesity Research 10: 370-378.
Beverage Patterns and Trends • The major food shifts: increased calorically- sweetened beverages; shift from whole to reduced fat milks; no data on water or tea or coffee trends yet • The trends are comparable across all age-gender groups but the levels are higher in some age groupings
Trends in Beverage Consumption Between 1977 and 2001 (the % of total daily calorie intake from each beverage for all Americans aged 2 and older) Percentage of daily calorie intake Source: Source:Nielsen & Popkin 2004 Am J Prev Med 27: 205-10. *All changes significant at the 0.01 level between 1977-78 and 1999-2001
Trends in the Mean Percentage of Consumers, Mean Servings/Day, and Mean Portions of Specific Beverages Calorically-Sweetened beverages Milk beverages Source: Source:Nielsen & Popkin 2004 Am J Prev Med 27: 205-10.
Trends in Sweetened Beverages and Milk Consumption by Location 1977-96. (Each figure represents the % of total daily calorie intake by location and meal type for each year) Source: Source:Nielsen & Popkin 2004 Am J Prev Med 27: 205-10.
U.S. Beverage Consumption in 1999-2001: What proportion of our calories come from each type of beverage? 0.3 0.3 1.0 0.5 0.3 0.3 0.9 4.8 2.7 0.3 3.5 1.6 1.2 0.6 2.0 8.3 3.8 1.1 4.9 Percentage of total daily kcal from each beverage 2.6 5.0 2.5 1.6 2.4 3.4 2.2 3.9 4.6 1.2 9.8 1.2 7.0 6.9 5.0 3.0 Source:Nielsen & Popkin 2004 Am J Prev Med 27: 205-10.
The Development of a Beverage Guidance System – future discussion not for press yet • Panel: desire for major scholarly figures in the dietary guidelines, diet and chronic disease epidemiology world, obesity, micronutrients and phytochemicals and health world, and hydration/exercise physiology/caffeine world. • Review the science about each beverage and consider what is known about the health benefits and risks of each category of beverages • Rank order in importance the beverage consumption patterns
Panel Members • Ben Caballero – Professor Johns Hopkins, member all IOM diet guidelines committees related to beverages • Walt Willett – Professor Harvard, senior diet and chronic disease epidemiologist • George Bray – Professor LSU, major obesity scholar • Balz Frei – Professor Oregon State Univ, key scholar on micronutrients, phytochemicals and beverages and health • Lawrence Armstrong – Professor U Conn, exercise physiologist, caffeine, hydration, performance scholar • Barry Popkin – Panel Head: Professor UNC, diet, obesity, nutrition epidemiologist
The Critical Health Concerns with Beverages • Total beverage needs for survival • Their energy density in terms of kcals/100ml • Their nutrient density in terms of nutrients deficient in our diet • For fruit juices, IOM states we need a maximum of 1/3 of fruits from fruit juice or 4-8 ounces per day • Their effects on health, in particular growth, obesity, and chronic diseases
Caloric Beverages and Weight Gain • Studies of appetitive sensations (e.g hunger, fullness, prospective consumption) support the view that fluids are less satiating than solid foods. In fact beverages are not sating at all during a specific meal and there is no energy adjustment • Further dietary compensation (energy intake adjustments made during the day to compensate for earlier intake) have been studied with solid, semisolid and fluid foods. For fluids, compensation is very high in the sense that minimal calorie reduction in other foods occurs
Level 1: Water • Water-essential for life • For average person with 2200 kcal per day: 16-24 ounces or more per day but this could provide all beverage needs of about 98 ounces • Needed for adequate hydration • Dehydration: impaired cognition, moodiness, physical work performance, increased risk of bladder, colon, breast cancer
Level 2: Tea and Coffee • Tea and Coffee – selected benefits on chronics, no adverse health effects in terms of obesity and chronic diseases. The only issue is for high added cream and sugar such as for gourmet coffees • Tea: animal work strong for tea’s protective role against selected cancers; unclear benefits in humans. Potential health benefits of flavonoids in tea are unclear • Coffee: mild antidepressant, some evidence lowers risk of Type 2 diabetes • Caffeine: 400 mg limit. 32 ounce limit coffee [150 mg caffeine limit if pregnant]
Level 3: Low Fat and Skim Milk and Soy Beverages • Skim Milk – unclear benefits on weight gain and bone density and fractures. Range of meta-analyses and one recent 48-week trial show no benefits for weight loss. Important benefits as protein source for child linear growth. Also major provider of calcium and vitamin D • Adult milk intake may adversely affect several chronic diseases (prostate cancer, ovarian cancer) • Current consumption patterns indicate milk products are important contributors of many key nutrients
Level 4: Noncalorically-Sweetened Beverages • High sweetness in these beverages holds the possibility that consumption of these sweet beverages may condition a preference for sweetness • Animal work suggests that altering the ability of the sensory properties of food to predict the caloric consequences of consuming that food may impact energy regulation and body weight
Level 5: Caloric Beverages with Some Nutrients • Fruit juices: high in energy content, contribute limited nutrients. IOM states that two-thirds of all fruit intake should be from fruit. Limit to 4-8 ounces/day • Vegetable juices: fewer calories, significant amounts of sodium • Whole milk: Saturated fats are not needed beyond infancy
Level 5: Caloric Beverages with Some Nutrients (continued) • Sports drinks – reduced energy density over soft drinks, helpful for hydrating endurance athletes, provides small amounts of key minerals • Alcohol – only the ethanol benefit is clear. Moderate intake (1 drink-women, 2 for men) linked with reduced mortality, CVD, type II diabetes
Level 6: Calorically-Sweetened Beverages • Calorically-sweetened beverages are associated with increase dental cares, Type II diabetes and weight gain • Animal and human research show a potential relationship with weight gain but the data are not conclusive yet
What is the proportion of energy from beverages a person should consume? • Today 21% of kcal from beverages. Need to reduce this level • Current food composition means about 81% of our water needs must come from beverages. This varies with fruit and vegetable intake patterns • IOM and USDA present one acceptable meal pattern for person with 2200 kcal needs. Only needs 14% of kcal from beverages. This is 2849 ml or 98 ounces
IOM Ideal Meal Layout of Beverages for Man with 2200 kcal Intake • The size of beverage needs varies based on diet [e.g., fruit and vegetables contain water], individual needs • Individuals can readily live with no kcal in diet from beverages • Clearly some people can also live with very high caloric intake from beverages but the hope is to reduce considerably the average American’s % of energy from beverages to 5-15% from the current 20% and higher level
Recommendations • Two options: the panel’s suggested beverage pattern. 10% of energy from beverages [or less] • Acceptable Beverage pattern (14% of energy from beverages)
LEVEL VI LEVEL V LEVEL IV LEVEL III LEVEL II LEVEL I Average Beverage Intake Patterns for U.S. Adults Aged 19 and Older, 1999-2002 a. Fluid Ounces Consumed b. Kcal Consumed per day Total 114 FL OZ Total 464 KCALS CALORICALLY- SWEETENED BEVERAGES (20 FL OZ) NONCALORICALLY- SWEETENED BEVERAGES (5 FL OZ) CALORICALLY- SWEETENED BEVERAGES (211 KCALS) CALORIC BEVERAGES WITH SOME NUTRIENTS (15 FL OZ) LEVEL VI TEA/COFFEE, UNSWEETENED (15 FL OZ) LOW FAT MILK (3 FL OZ) CALORIC BEVERAGES WITH SOME NUTRIENTS (213 KCALS) NONCALORICALLY- SWEETENED BEVERAGES (1 KCALS) LEVEL V WATER (46 FL OZ) LEVEL IV LOW FAT MILK (29 KCALS) LEVEL III TEA/COFFEE, UNSWEETENED (11 KCALS) LEVEL II WATER (0 KCALS) LEVEL I
ALCOHOL (BEER) (12 FL OZ) FRUIT JUICES (8 FL OZ) Suggested and Acceptable Beverage Consumption Patterns for a Person with a 2200 kcal Energy Requirement per Day a. Suggested Pattern(10% of energy from beverages) b. Acceptable Pattern(14.% of energy from beverages) Total 98 FL OZ Total 98 FL OZ CALORICALLY-SWEETENED BEVERAGES WITHOUT NUTRIENTS (0 FL OZ) CALORICALLY-SWEETENED BEVERAGES WITHOUT NUTRIENTS (0 FL OZ) ALCOHOL (BEER) (0 FL OZ) CALORICALLY SWEETENED WITH NUTRIENTS FRUIT JUICES (4 FL OZ) LEVEL VI LEVEL VI CALORICALLY SWEETENED WITH NUTRIENTS LEVEL V LEVEL IV LEVEL V LOW FAT MILK (16 FL OZ) LEVEL III NONCALORICALLY- SWEETENED BEVERAGES (0 FL OZ) NONCALORICALLY- SWEETENED BEVERAGES (12 FL OZ) LEVEL IV TEA/COFFEE, UNSWEETENED (28 FL OZ) LEVEL II LOW FAT MILK (6 OZS) LEVEL III TEA/COFFEE, UNSWEETENED (36 FL OZ) LEVEL II WATER (50 FL OZ) LEVEL I WATER (24 FL OZ) LEVEL I Footnote: The Panel suggests a range for each level of beverage that is from 100% water to: Water 20-50 fl oz/d; tea and coffee (unsweetened) 0-40 fl oz/d (can replace water; caffeine is a limiting factorup to 400 mg/d or about 32 fl oz/d of coffee); low fat and skim milk and soy beverages 0-16 fl oz/d; noncalorically-sweetened beverages 0-32 fl oz/d (could substitute for tea and coffee with the same limitations regarding caffeine); caloric beverages with some nutrients: 100% fruit juices 4-8 fl oz/d, alcoholic beverages 0-1 drink per day for women and 0-2 drinks per day for men, whole milk 0 fl oz/d; calorically sweetened beverages 0-8 fl oz/d.
Discussion: so how do we address the beverage issue in the US • Our goal: make public and scientific community aware of large increase in calories from beverages • Make public and scientists more aware of lack of compensation with other foods when consume beverages with calories. Beverage do not provide satiety • Make the public aware of the benefits of beverages with little or no calories and the true needs from milk and juices