Download
1 / 17
170 likes | 306 Views
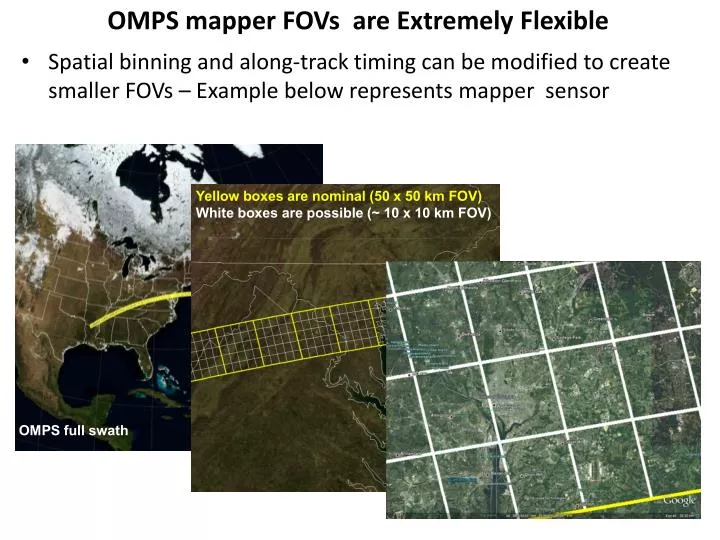
Yellow boxes are nominal (50 x 50 km FOV) White boxes are possible (~ 10 x 10 km FOV). OMPS full swath. OMPS mapper FOVs are Extremely Flexible. Spatial binning and along-track timing can be modified to create smaller FOVs – Example below represents mapper sensor .

E N D
Yellow boxes are nominal (50 x 50 km FOV) White boxes are possible (~ 10 x 10 km FOV) OMPS full swath OMPS mapper FOVs are Extremely Flexible • Spatial binning and along-track timing can be modified to create smaller FOVs – Example below represents mapper sensor
NPP/OMPS/NM high-res needs for Volcanic hazard Applications Customers: USAID/USGS Volcano Disaster Assistance Program; NOAA/NESDIS/OSDPD/SSD/ Washington and Anchorage Volcano Ash advisory Centers; Alaska and Cascades Volcano Observatories; NWS meteorological Watch Offices High-resolution OMPS SO2 data are needed for improved volcano monitoring in localized pre-eruptive mode and hazard mitigation for drifting volcanic ash clouds. OMI NRT SO2 data for volcanic cloud from Merapi volcano in Indonesia in November 2010 are integrated into operational N-AWIPS display used as DSTs by Washington and Alaska VAACs and NWS meteorological Watch Offices. High-resolution OMPS/NM SO2 data will allow uninterrupted volcanic near-real time monitoring service.
Manam Ulawun Bagana PAPUA NEW GUINEA Tinakula SOLOMON Is VANUATU Aoba Ambrym • Volcanic degassing in the Southwest Pacific • Operational OMI SO2 data (April 23, 2006) displayed using actual OMI pixels • OMI spatial resolution permits identification of SO2 degassing from 6 volcanoes
Manam Bagana PAPUA NEW GUINEA Tinakula? SOLOMON Is VANUATU Aoba? Ambrym? • OMI data resampled at ~50×50 km nominal OMPS spatial resolution • Some plumes now indistinguishable from noise; others have ambiguous sources
Manam Ulawun Bagana PAPUA NEW GUINEA Tinakula SOLOMON Is VANUATU Aoba Ambrym • OMI data resampled at ~10×10 km potential OMPS spatial resolution • Individual volcanic plumes resolved • Conclusion: 10 km spatial resolution (or better) is required to accurately identify sources of volcanic SO2 – essential for effective monitoring and hazard mitigation
NPP/OMPS/NM high res needsfor Air Quality Applications Customers: NASA - Air Quality Applied Science Team NOAA - better Air Quality Forecast EPA - monitoring emissions from point pollution sources State Departments of environment (e.g., MDE )
Monitoring point sources (e.g., smelters, Power Plants) requires high ground resolution OMPS mapper data SO2 Source #10 (John Amos power plant, 2900 MW, ~110 kT/year of SO2)
SO2 from OMI, average for 2005-2010 For each grid point of a 2x2 km grid, all overpasses centered within a 12 km from that point were averaged 60 km Peak SO2 signal within 20km 60 km OMPS current operational pixel size OMI smallest pixel size OMPS high-res pixel size
Mean OMI SO2 for 2005-2010Sources #22and #26. There are two emission sources in this area, but they appear as one if the satellite resolution (smoothing window) is too largeRadius: 12km 24 km
Power Plants NOT detectable in low resolution data (SCIA) can be monitored with high resolution data: OMI and high-res OMPS/NM e.g., Megalopolis coal Power Plant, Greece SCIAMACHY, 2004-2011 OMI, 2004-2011 13km by 24km 30km by 60km DU
Megalopolis SO2 emission is larger than any US source - high resolution measurements from OMPS/NM are required to continue OMI SO2 record Megalopolis, Greece Cluster of US Power Plans OMI, 2005-2007 DU
High resolution measurements from OMPS/NM are required to continue monitoring SO2 pollution trends globally 2005-2007 2008-2010 US Source #1.Bowen Coal Power Plant, Georgia (3500 MW), SO2 emissions: 170 kT “In 2008, the mammoth construction program yielded the first scrubbers, sophisticated equipment that will reduce our overall systems emissions by as much as 90 percent” Georgia Power website Courtesy VitaliFioletov EC
Emissions in Developing Countries - high resolution measurements from OMPS/NM required for timely update of emission information Information concerning pollutant emissions in the developing world often not available or lags behind the vibrating economy Emissions from some power plants are more easily picked up in 0.25° × 0.25° data Courtesy Can Li, ESSIC Triangles: some areas with newly built coal-fired power plants near coal mines in Inner Mongolia of China 0.5° × 0.5° data more smooth, signal of power plants either weak or not discernible from surrounding areas With high-resolution data, timely update of emission sources in these regions is possible, and relies less on “inside” information.
Long-Range Transport - high resolution measurements from OMPS/NM are required for detailed investigation of mechanisms (b) MODIS retrieval not available over clouds and bright surfaces, but more detailed spatial feature. MODIS AOD 10 km at nadir MODIS RGB Courtesy Can Li, ESSIC A dust plume wrapped around a front system over NE China in 2006 OMI with better spatial coverage – important for studying transport mechanisms. More detailed data will facilitate comparison to mesoscale models (c) • Long-range transport of dust and pollutants often associated with mid-latitude cyclones – mixed scene of dust, pollutants, and clouds • Greater spatial resolution is necessary for detailed studies on the transport mechanisms OMI AI 1° resolution
Biomass Burning - high resolution measurements from OMPS/NM useful for determining plume height Global distribution of high-altitude plumes with an AI ≥ 9 (i.e. height ≥5 km) during 31 October 1978 to 13 February 2009) Relationship between OMI AI and CALIPSO plume height for large biomass burning plumes – works better for AI ≥ 9 (Guan et al., ACP, 2010) • The height of biomass burning plumes extremely important for their regional impact • Guan et al. (2010) demonstrated a technique linking plume height to AI value • Given the resolution of the data (~1°), only applicable to the largest plumes, and sampling over SE Asia and Africa is very limited • Fine resolution data may be useful for determining the height of relatively small burnings
Megacity Pollution - high resolution measurements from OMPS/NM are required to investigate the impact of megacity pollution 1 km AOD vs. PM10 Short-lived species even more inhomogeneous, for example: NO2 almost halved ~50 km away from the center of a big city. 50 km downwind City Center 10 km AOD vs. PM10 Zonally integrated OMI NO2 column densities (mean ± SME) for westerly (blue) and easterly (red) winds as function of the distance to Riyadh City center x. (Beirle et al., Science, 2011) Advantage of high-resolution data in air quality study. Example here shows high resolution AOD has better correlation with surface aerosol measurements in Hong Kong (Li et al., IEEE, 2005)