Download
1 / 14
170 likes | 191 Views
. Primer for Skew-T Diagram Use In Atmospheric Thermodynamics. Location of Chart Lines Saturation Point. Table of Contents. 600 700 800 900 1000. The Skew-T diagram contains multiple parameters to calculate thermodynamic variables. They include: Pressure - p (mb).

E N D
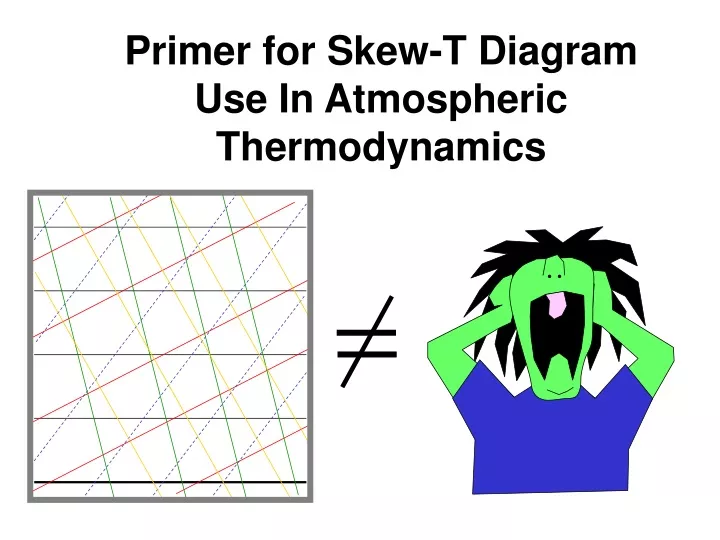
. . Primer for Skew-T Diagram Use In Atmospheric Thermodynamics
Location of Chart Lines Saturation Point Table of Contents
600 700 800 900 1000 • The Skew-T diagram contains multiple parameters to calculate thermodynamic variables. • They include: • Pressure - p (mb)
The Skew-T diagram contains multiple parameters to calculate thermodynamic variables. • They include: • Pressure - p (mb) • Temperature - T 600 700 800 900 1000
The Skew-T diagram contains multiple parameters to calculate thermodynamic variables. • They include: • Pressure - p (mb) • Temperature - T • Saturation Mxing Ratio - rv 600 700 800 900 1000
The Skew-T diagram contains multiple parameters to calculate thermodynamic variables. • They include: • Pressure - p (mb) • Temperature - T • Saturation Ratio - rv • Saturated Adiabats - e 600 700 800 900 1000
The Skew-T diagram contains multiple parameters to calculate thermodynamic variables. • They include: • Pressure - p (mb) • Temperature - T • Saturation Ratio - rv • Moist Adiabats - e • Dry Adiabats - 600 700 800 900 1000
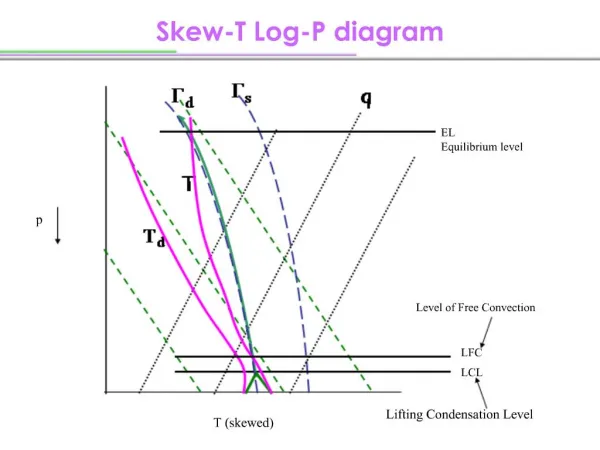
Saturation Point Given T and dew point (Td) at a specific pressure, locate the saturation point. 600 700 800 900 1000
Saturation Point Given T and dew point (Td) at a specific pressure, locate the saturation point. Inputs: a) Temperature at p0 600 700 800 900 1000 T
Saturation Point • Given T and dew point (Td) at a specific pressure, locate the saturation point. • Temperature at p0 • Dewpoint temperature at p0 600 700 800 900 1000 Td T
Saturation Point Given T and dew point (Td) at a specific pressure, locate the saturation point. Draw a line from T, parallel to the dry adiabat… 600 700 800 900 1000 Td T
Saturation Point Given T and dew point (Td) at a specific pressure, locate the saturation point. Draw a line from T, parallel to the dry adiabat, and a line from Td, parallel to rvs… 600 700 800 900 1000 Td T
Saturation Point Given T and dew point (Td) at a specific pressure, locate the saturation point. Draw a line from T, parallel to the dry adiabat, and a line from Td, parallel rv. The intersection is the saturation point. 600 700 800 900 1000 Saturation point Td T
Saturation Point Given T and dew point (Td) at a specific pressure, locate the saturation point. Saturation pressure at T and Td can be determined. 600 700 800 900 1000 psp