Download
1 / 11
110 likes | 114 Views
Chapter 3. Graphs and Functions. Chapter Sections. 3.1 – Graphs 3.2 – Functions 3.3 – Linear Functions: Graphs and Applications 3.4 – The Slope-Intercept Form of a Linear Equation 3.5 – The Point-Slope Form of a Linear Equation 3.6 – The Algebra of Functions

E N D
Chapter 3 Graphs and Functions
Chapter Sections 3.1 – Graphs 3.2 – Functions 3.3 – Linear Functions: Graphs and Applications 3.4 – The Slope-Intercept Form of a Linear Equation 3.5 – The Point-Slope Form of a Linear Equation 3.6 – The Algebra of Functions 3.7 – Graphing Linear Inequalities
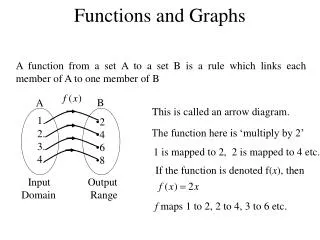
Graph Linear Functions Linear Function • A linear function is a function of the form f(x) = ax + b • The graph of any linear equation is a straight line. • The domain of any linear function is all real numbers. • If a ≠ 0, then the range of any linear function is all real numbers.
Graph Linear Functions Using Intercepts Standard Form of Linear Equation The standard form of a linear equation is ax + by = c where a, b, and c are real numbers, and a and b are not both 0.
Graph Linear Functions Using Intercepts x- and y-intercepts • The x-intercept is the point at which a graph crosses the x-axis. • The x- intercept will always be of the form (x, 0). • The y-intercept is the point at which a graph crosses the y-axis. • The y-intercept will always be of the form (0, y).
Graph Linear Functions Using Intercepts To Graph Linear Equations Using the x- and y-intercepts Find the y-intercept. Set x equal to 0 and find the corresponding value for y. Find the x-intercept. Set y equal to 0 and find the corresponding value for x. Plot the intercepts. Draw the line. Using a straightedge, draw a line through the points. Draw an arrowhead at both ends of the line.
Graph Using Intercepts Example: Graph 5x = 10y – 20 using the x- and y-intercepts. Solution To find the y-intercept, set x = 0 and solve for y. This gives us the y-intercept (0, 2).
Graph Using Intercepts To find the x-intercept, set y = 0 and solve for x. This gives us the x-intercept (-4, 0). Use the intercepts (0, 2) and (-4, 0) to graph the linear function.
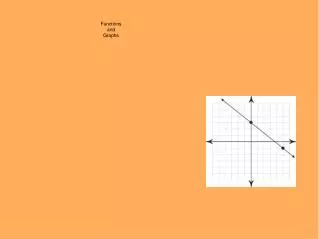
Graph Using Intercepts Plot the points and draw the line.
Graph Equations of the Form x = a and y = b Equations of a Horizontal Line The graph of any equation of the form y = b will always be a horizontal line for any real number b. Equations of a Vertical Line The graph of any equation of the form x = a will always be a vertical line for any real number a.