Download
1 / 40
430 likes | 905 Views
Strategy, Balanced Scorecard, and Strategic Profitability Analysis. Chapter 13. April 18, 2005. Learning Objective 1. Recognize which of two generic strategies a company is using. What is Strategy?. Strategy describes how an organization matches

E N D
Strategy, Balanced Scorecard, andStrategic Profitability Analysis Chapter 13 April 18, 2005
Learning Objective 1 Recognize which of two generic strategies a company is using.
What is Strategy? Strategy describes how an organization matches its own capabilities with the opportunities in the marketplace to accomplish its overall objectives. To do so requires a thorough understanding of the industry in which it operates.
What is Strategy? What is the focus of industry analysis? Competitors Potential entrants into the market Equivalent products Bargaining power of customers Bargaining power of input suppliers
Basic Strategies 1. Product differentiation 2. Cost leadership
Product Differentiation • Products of services perceived to be superior and unique relative to its competitors • Achieved through innovative R & D, service and branding • Examples: Kleenex, Xerox, Coca Cola; Mercedes, Lexus; Prius
Cost Leadership • Lower costs relative to the competition • Achieved through productivity and efficiency improvements, tight cost control, unique sourcing of materials, etc. • Examples: Costco, Walmart; Honda, Dell, Home Depot;
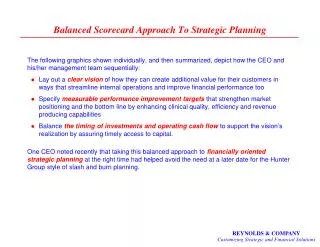
Implementation of Strategy Management accountants design reports to help managers track progress in implementing strategy.
The Balanced Scorecard The scorecard measures an organization’s performance from four perspectives: 1. Financial – reduce costs, sell more 2. Customer – satisfaction, market share 3. Internal business processes – manufacturing, quality, delivery, service and support 4. Learning and growth – employee, systems
Learning Objective 2 Identify what comprises reengineering.
Reengineering Reengineering is the fundamental rethinking of business processes to achieve improvements in critical measures of performance such as cost, quality, service, speed, and customer satisfaction.
Reengineering Example Dallas Co. order delivery system: Customers needs identified Quantities to be shipped matched against purchase order Purchase order issued Shipping documents sent to Billing Department Production scheduled Manufacturing completed Invoice issued Finished goods to inventory Customer payment follow up
Reengineering Example The following was determined: Frequently, there is a long waiting time before production begins in the manufacturing department. Sometimes items are held in inventory until a truck is available for shipment. There is no one person responsible for tracking and following up on a customer
Reengineering Example If the quantity shipped does not match the number of items requested by the customer, a special shipment must be scheduled. Dallas discovered that the many transfers across departments slowed down the process and created delays. A multifunctional team reengineered the order delivery process.
Reengineering Example A customer relationship manager is responsible for each customer. Dallas will enter into long-term contracts with customers specifying quantities and prices. The customer relationship manager will work with the customer and manufacturing to specify delivery schedules one month in advance.
Reengineering Example The schedule of customer orders will be sent electronically to manufacturing. Completed items will be shipped directly from the manufacturing plant to customer sites. Each shipment will automatically trigger an invoice to be sent electronically to the customer.
Learning Objective 3 Present the four perspectives of the balanced scorecard.
Perspectives of Performance 1. Financial 2. Customer 3. Internal business process 4. Learning and growth
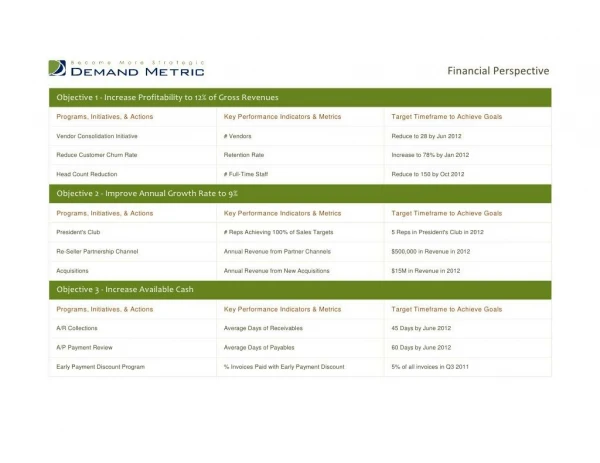
Financial Perspective Objective: Increase shareholder value Measures: Increase in operating income
Financial Perspective Initiatives: Target Performance Actual Performance Manage costs and unused capacity - productivity $2,000,000 $2,100,000 Build strong customer relationships - profit $3,000,000 $3,420,000 Build strong customer relationships - growth 6% 6.48%
Customer Perspective Objectives: Increase market share Increase customer satisfaction Measures: Market share in communication networks segment Customer satisfaction survey
Customer Perspective Initiatives: Target Performance Actual Performance Increase market share, Needs of customers 6% 7% Identify new target customer segments 7 8 Increase customer focus of sales organization 90% give top two ratings 87% gave top two ratings
Internal BusinessProcess Perspective Objectives: Improve manufacturing quality and productivity Meet specified delivery dates Measures: Yield On-time delivery
Internal BusinessProcess Perspective Initiatives: Target Performance Actual Performance Identify problems and improve quality, yield 78% 79.3% Reengineer order delivery process, on time delivery 92% 90%
Learning and Growth Perspective Objectives: Align employee and organization goals Improve manufacturing processes Measures: Employee satisfaction survey Improvements in process controls
Learning and Growth Perspective Initiatives: Target Performance Actual Performance Employee participation and suggestion program to build teamwork 80% of employees give top two ratings 88% of employees give top two ratings Organize R&D/ manufacturing teams to modify processes 5 5
Aligning the BalancedScorecard to Strategy Different strategies call for different scorecards. What are some of the financial perspective measures? Operating income Revenue growth Cost reduction is some areas Return on investment
Aligning the BalancedScorecard to Strategy What are some of the customer perspective measures? Market share Customer satisfaction Customer retention percentage Time taken to fulfill customers requests
Aligning the BalancedScorecard to Strategy What are some of the internal business perspective measures? Innovation Process: Manufacturing capabilities Number of new products or services New product development time Number of new patents
Aligning the BalancedScorecard to Strategy Operations Process: Yield Defect rates Time taken to deliver product to customers Percentage of on-time delivery Setup time Manufacturing downtime
Aligning the BalancedScorecard to Strategy Post-sales service: Time taken to replace or repair defective products Hours of customer training for using the product
Aligning the BalancedScorecard to Strategy What are some of the learning and growth perspective measures? Employee education and skill level Employee satisfaction scores Employee turnover rates Information system capability Processes with real time feedback
Pitfalls When Implementinga Balanced Scorecard What pitfalls should be avoided when implementing a balanced scorecard? 1. Don’t assume the cause-and-effect linkages to be precise; it will evolve 2. Don’t seek improvements across all measures all the time; may need tradeoffs 3. Don’t use only objective measures on the scorecard; subjective such as satisfaction
Pitfalls When Implementinga Balanced Scorecard 4. Don’t fail to consider both costs and benefits of initiatives such as spending on information technology and research and development. 5. Don’t ignore nonfinancial measures when evaluating managers and employees. 6. Don’t use too many measures.
Learning Objective 5 Downsizing and the management of excess capacity First, distinguish between engineered and discretionary costs.
Engineered Costs Engineered costs result specifically from a clear cause-and-effect relationship between output and the resources needed to produce that output. They can be variable or fixed in the short run. Examples include direct material, labor and overhead. These costs are activity driven.
Discretionary Costs Discretionary costs have two important features. They arise from periodic (usually yearly) decisions regarding the maximum amount to be incurred. They have no measurable cause-and-effect relationship between output and resources used. Examples include advertising, R & D, training, legal, human resources and public relations
Learning Objective 6 Identify unused capacity and how to manage it.
Managing Unused Capacity What actions can management take when it identifies unused capacity? Attempt to eliminate the unused capacity. Cutting processes, jobs can reduce morale Attempt to use the unused capacity to grow revenue A much better alternative