Download
1 / 12
120 likes | 268 Views
Using Autoplot in the Heliophysics Data Environment SM31A-1864. Jeremy Faden (1, 2); R. S. Weigel (3); R. H. Friedel (4) 1. Cottage Systems, Iowa City, IA, United States. 2. The University of Iowa, Iowa City, IA, United States. 3. George Mason University, Fairfax, VA, United States.

E N D
Using Autoplot in the Heliophysics Data EnvironmentSM31A-1864 Jeremy Faden (1, 2); R. S. Weigel (3); R. H. Friedel (4) 1. Cottage Systems, Iowa City, IA, United States. 2. The University of Iowa, Iowa City, IA, United States. 3. George Mason University, Fairfax, VA, United States. 4. Los Alamos National Labs, Los Alamos, NM, United States. Autoplot is software for plotting data from many different sources and in many different formats. All data is converted to a common data model before plotting. It is used in the Heliophysics Data Environment as a plotting tool that is easily interfaced to websites, but also as a uniform way to bring data into environments like IDL and Matlab. It also handles data aggregation, so the problem of combining data granules into a useful data set is moved to the client side, allowing data servers to be simple and allowing anyone with a website to publish data. Also the SPASE data model has matured and can be used as a source of metadata. New features, such as multi-panel plots, slicing, and a png walk generator are presented as well.
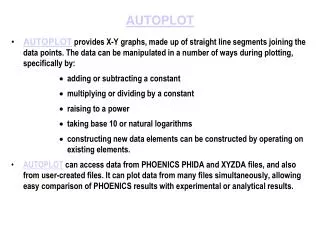
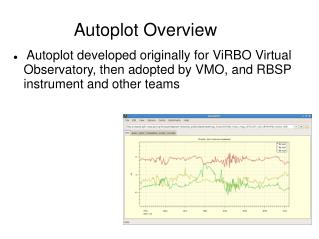
Introduction Autoplot is plotting software that plots data from many different data sources including CDAWeb, ViRBO, VMO. Image from CDF File Scalar Time Series Bz(Time) from ASCII File Vector Time Series from CDF File Spectral Time Series Flux(Time,En) from CDF file On-the-fly graphics on ViRBO SST(Time,Lat,Lon) Qube from NetCDF File
Using Autoplot All data in Autoplot has a data address, or URI, that identifies it. The address is entered in the address bar, and the data is loaded and displayed. Typically URIs are the names of datafiles, and additional parameters needed to access. Example URIs can be found in Bookmarks->Demos. File->Add Plot... Dialog is used to add additional plots. Time axes are automatically bound together, but they can be disconnected.
Developing URIs Typically URIs would be created by data providers, but end users create them as well. Data source plug-ins provide completions, and some provide an editor. Completions for OpenDAP data URI. Some URIs are complex, so editors make it so users don't have to think about them. The folder icon next to the URI bar enters the editor.
Developing URIs We've introduced new ways to create URIs. Some data sources allow for data “discovery.” These can be entered immediately to create valid URIs with its editor. Also brand-new are “remote bookmarks,” which is a folder of bookmarks maintained at a different site. Data providers can create a folder for all workgroup users.
Output from Autoplot Input from local data files or over ftp, http, sftp, and within a zip, or special servers. Render to PNG and PDF Save application state to .vap file,email .vap to colleague Cut and paste image into email or PowerPoint Export data into ASCII table, Excel spreadsheet, CDF file, Binary table and more Creating a png image from data URI on the command line: java -cp AutoplotAll.jar org.virbo.autoplot.AutoplotServer -u "http://autoplot.org/data/autoplot.cdf?BGSM" -o BGSM.png
Autoplot in Web Servers Website links to autoplot.org's server that launchesapp with its configuration. Java Webstart Autoplot called from the command line on the server to produce graphics Autoplot can can also be embedded in Java-based web servers (like Apache Tomcat) as a webapp, or as an applet to make interactive plots within a web page. It can be used off-line as well, as a command line application.
Matlab/IDL interface Autoplot's data access libraries can be used to read data into IDL and Matlab. The design goal is if you can see it in Autoplot you should be able to read the digital data into these data environments. This interface has been around since early on, butis getting more attention and is therefore maturing. % Download ~18 MB jar file javaaddpath('http://www.autoplot.org/autoplot/images/AutoplotAll.jar'); apds= org.virbo.idlsupport.APDataSet; apds.setDataSetURI( 'vap+das2server:http://cassini.physics.uiowa.edu/das/das2Server ?dataset=cassini/mag/mag_vector&start_time=2010-08-16&end_time=2010-08-17' ) apds.doGetDataSet; y= apds.values; apds.setPreferredUnits('seconds since 2010-08-16T00:00Z') x= apds.values('ds_0'); plot(x,y) Use with IDL is similar, but a couple extra lines of code are needed to load the jar file. Note CDF files cannot be read with native reader, so the experimental Java one must be used instead. Prefix URIs with “vap+cdfj:” to use this reader.Autoplot can also be used for plotting in IDL and Matlab.
Autoplot PNGWalk Tool PngWalk Tool creates a time series of images. Here we make plots for the month of May 1999
What's Coming Conventions for storing metadata in ASCII files. Some server developers are looking for a format, and don't mind having a spec for their output. We're developing a model for representing metadata in ASCII files, based on JSON, that will be supported. SPASE searches. A number of SPASE-based search engines are popping up, and Autoplot will leverage them. Ephemeris axes labels. Das2, the graphics library used, has always been able to do this using a special server, and this will be generalized to allow input from any data source. SPICE plug-in that can generate ephemeris (S/C location) for existing and new missions. New rendering types, such as event bars, contour plots, and maps.
Where to Get It Integrated into a number of different servers—you may have already used it. Autoplot.org carries the canonical production release, and incremental development releases. This is a jnlp application, which tells Java how to launch it. It should work fine on any desktop or server with Java 1.5 or better on it, which is available for Linux, Solaris, Macs, and Windows machines. http://autoplot.org/autoplot.jnlp?<your-data> is a cgi that will launch Autoplot with your data. Also http://groups.google.com/group/autoplot is the discussion group for the software.where you'll get release announcements and you can ask questions or make suggestions for the software. Autoplot is open source and can be found on SourceForge by searching for “autoplot.”
Acknowledgements: Support from Tami Kovalick, Bernie Harris, Bobby Candey, Bob McGuire from CDF group; Nand Lal from CDF for Java-based CDF reader; Jared Leisner, Ivar Christopher, Larry Granroth, Joanne Seeberger, Jolene Pickett, Bill Kurth, Doug Menietti, Chris Piker from Plasma Wave Group at U. Iowa for feedback and testing; Ed West from Plasma Wave Group for consulting; Craig Kletzing, Scott Bounds, Dan Crawford, Steve Kaeppler from U. Iowa; Jon Vandegriff at APL; Brian Larsen, Jon Niehof, Micheal Henderson at LANL; John Sigwarth, Aaron Roberts at Goddard. • This effort is funded under: • NNX10AN12G: VxO for S3c Data: ViRBO • NNG09E182P: Web Interface to the CEPPAD Archive • LANL RBSP ECT team under LANL PO#720280019 • NNX10AG12G: VO Downloader and HelioLib – a Tool and a Library for Science Data • NNX09AJ01G: EMWRAP: EM Waves Resident Archive for Polar • APL 921647: U. Iowa RBSP ECT team