Download
1 / 32
400 likes | 866 Views
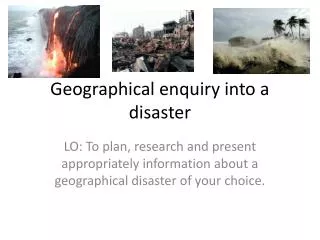
Geographical Enquiry An Introduction to Geography. Contents. What is geographical enquiry? General techniques Presenting data and analysing results Summary activities. The key concepts covered are: Place , Space and Physical and human processes. What is geographical enquiry?.

E N D
Contents • What is geographical enquiry? • General techniques • Presenting data and analysing results • Summary activities The key concepts covered are: Place, Space and Physical and human processes.
What is geographical enquiry? What is geographical enquiry? By the end of this section, you will: • Discuss how geographers conduct enquiries and collect data. • Discuss the implications of fieldwork for health and safety and its impact on the chosen site.
Why do we enquire? We conduct enquiries to find out what is happening in our world, to make sense of what has happened in the past and to make judgements about what might happen in the future. When conducting enquiries, geographers formulate a hypothesis, research the topic, obtain data and then analyse data to prove or disprove a hypothesis. What enquiries are geographers conducting today?
Current geographical enquiries Geographers are investigating many topics. These include: • the impact of climate change • population studies • the impact of industry. What topics do you think are most relevant today?
Creating a hypothesis A hypothesis is an idea which can be investigated and found to be true or false. Research is the way geographers gather information to prove or disprove a hypothesis or a set of hypotheses. Example hypotheses: • A river gets wider as you move downstream. • The school building produces its own microclimate. • Land use in the town centre is mostly commercial. What data could you collect to prove or disprove each hypothesis?
Your enquiry title…. • How could we improve the environmental quality of the school site?
Types of research Secondary research involves collecting and collating data from existing sources. Secondary research might include: • web research • library research • drawing conclusions from someone else's work. Primary research is where data is gathered on the front line. This might include observations, interviews and experiments. Geographers call this type of research fieldwork.
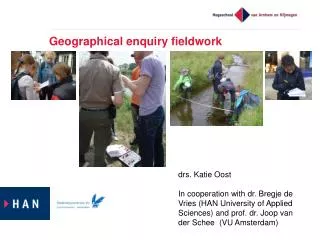
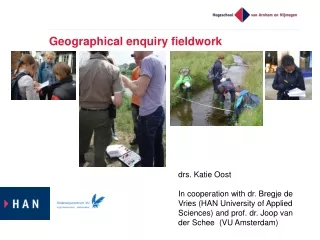
What is fieldwork? Geographers do fieldwork in order to gather data for study. Fieldwork takes place in a specific location where observations are made and measurements taken. Why is fieldwork important to geographers? Fieldwork allows us to find out about the human and physical world around us. This world is always changing and fieldwork provides us with information about the changes.
Location, location, location Planning where to do fieldwork is a central part of investigating a particular hypothesis. A site must be safe, accessible, and a likely source of relevantdata. In addition to being safe and collecting suitable data, good fieldwork aims to have minimal environmental impact on a site. How might you make an impact on an environment whilst doing fieldwork?
Fieldwork notebook A fieldwork notebook is useful to record any measurements. A table with headings can help organize the data collected. Location: Weather: Site 1 Average Site 2 Site 3 Width Depth Speed
Reading and observing Record your readings, measurements and tallies in neat tables. Remember to make a note of details that may influence your data. These might include weather conditions, the time of day or whether it’s a public holiday. Make field sketches of interesting features at the site. Label the sketches to draw attention to specific details.
Writing a questionnaire • yes or no answers • Closed (categories)- possibly a few open questions • not too many questions • easy to read lay out • Able to collect all answers on one sheet Need information on: • People’s opinions of the school • Areas that are attractive and less attractive • Ideas about what could be done to improve the area
Clear set out Boxes to tick or cross Headings in bold to make it clear Large title
To much writing to fill in. Will take too long and people won’t want to fill it in. To much information to read in the introduction Not obvious what questions are asking
General techniques General techniques By the end of this section, you will: • Think about ways to set up a field notebook and what notes should be made in it. • Observe how field sketches are produced and practice drawing and annotating them.
Presenting data and analysing results Presenting data and analysing results By the end of this section, you will: • Be able to present your data inan acceptable format. • Interpret data in order to accept or reject different hypotheses.
Structure of your report • Writing up the results: • Introduction: • Explain what you are trying to find out in your study • Method: • Explain how you collected your information and why you did it in this way • Presentation of data: • Include a range of presentation methods e.g. graphs and tables, annotated maps, annotated field sketches and photos • Description and explanation of results: • Using the data you have collected explain which areas of the school you and the people you surveyed think are the best and which areas you and the people surveyed think are the worst and EXPLAIN why you got these results. • For areas of the school that you think need to be improved explain (and possibly include annotated plans for improvement) of what could be done to improve the areas.
Presenting data After collecting data, you need to be able to present it in aformat where in can be easily understood, and interpreted to prove or disprove your hypothesis. Good forms of presenting data include: • tables • charts and graphs • thematic maps (like choropleth maps). All of the above could be incorporated into a written formal report.
Returning to the hypothesis The data collected during fieldwork and presented as results is used to test the hypothesis. It is analysed for patterns and trends that shed light on the subject of the hypothesis. What do you do with the hypothesis? If the analysis of fieldwork data shows the hypothesis to be true, geographers say they accept the hypothesis. If the analysis of fieldwork data shows the hypothesis to be untrue, geographers say they reject the hypothesis.
Summary activities Summary activities By the end of this section, you will: • Consolidate knowledge of geographical enquiry. • Revise definitions of key terms.