Download
1 / 28
280 likes | 369 Views
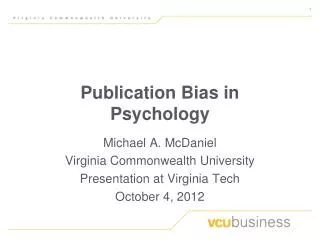
Forecasting 2012-14 Finances for Virginia’s Localities. James J. Regimbal Jr. VML Finance Forum December 1, 2011. APA Comparative Report, fiscal year 2010 Note: State figures exclude communication sales tax. Locality-Generated Revenues D epend on Real Property Taxes.

E N D
Forecasting 2012-14 Finances for Virginia’s Localities James J. Regimbal Jr. VML Finance Forum December 1, 2011
APA Comparative Report, fiscal year 2010 Note: State figures exclude communication sales tax
Locality-Generated Revenues • Depend on Real Property Taxes Source: Auditor of Public Accounts Comparative Report of Revenues and Expenditures Note: Communication sales taxes no longer considered local revenue – state appropriated 3
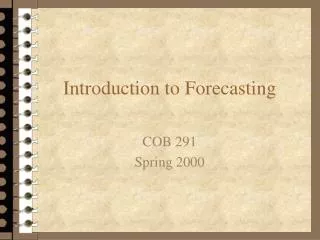
Most Local Government Expenditures are Mandated or Regulated by the State Source: Auditor of Public Accounts Comparative Report of Revenues and Expenditures
…But With Falling State Funding Source: APA Comparative Reports on Local Revenues and Expenditures 5
And a Continuing Real Estate Recession Source: 1990-2010, Auditor of Public Accounts FY 11 & 12 estimates from VML/VACO Fiscal Survey
Recession Took a Bite Out of State General Funds for Locally-Administered Programs * $32 mil. unspent in FY 11
State Aid For Locally-Delivered Programs Was Not a Priority in the 2011 Session • Out of $615 million in additional 2011 Session biennial GF revenues, locally-delivered programs received an increase of about $78 million - 13 percent of the additional funding. Priorities were: - Higher Education - Medicaid - Partial restoration of VRS - Mental Health - Rainy Day Reserve - Transportation and Economic Development - VITA Contract 8
Locals Also See Little New State Aid From FY 2011 Surplus 9 9
Can Other Payors Continue to Absorb More State Costs? NGF GF GF avg. annual growth rate = 2.7% NGF avg. annual growth rate = 6.9% 10 10
NGF Has Supported Largest Changes in State Appropriations - All Funds ($ Mil.)
State Budget Drivers% Change FY 2001 – FY 2010 Sources: JLARC Review of State Spending, December, 2010. Governor’s Advisory Council on Revenue Est., Dec. 2010 12
Policy Initiatives Have More Than Neutralized 2004 Tax Increase 13
Reasons the state will not restore cuts to core programs • Revenues not growing as fast as usual coming out of a recession (under 5% revenue growth expected in 2012-14). • Rainy Day Fund must be restored– Half of any GF revenue growth above prior 6-yr. avg. (2% now) goes to RDF. • 3. VRS contribution rates for teachers and state employees will be significantly increased. • 4. Medicaid spending continues to grow faster than state revenues. 2014 impact of federal health care big unknown, but law as written wouldadd up to 425,000 new Medicaid recipients. • Use of one-time revenues/savings in recession have to be replaced with ongoing revenues. • Concern over potential impact of federal deficit reductions.
Retirement Rates Set to Rise Notes: Employer rates only and do not include 5% member contribution. Over the last 10 years ending June 30, 2011 VRS annual average total fund investment return has been 5.7%. 16 16
Note: Does not include CSA and MHMR facility reimbursements. FY 2011 includes the shifting of $262 million from FY 12 to capture higher federal FMAP match. 17
Federal Stimulus Funding Helped Offset State GF Reductions 18 18 18 18
… Plus Other Non-Recurring Revenues Were Used to Offset Declining GF • Rainy Day Fund - $783 mil. • Reduce VRS state employee and teacherretirement/benefit contributions - $850 mil. • Replacing Capital Outlay Cash With Debt - $350 mil. • Accelerated Sales Tax for Dealers - $227 mil. • Capture NGF balances and interest earnings - $113 mil. • Tax Amnesty - $102 mil. • Eliminate Sales Tax Dealer Discount for Electronic Filers - $98 mil. 19 19 19
Mandatory and High Priority Spending Alone Exceed Est. Revenues in 2012-14
2012 Session Fiscal Policy Issues • Will the Governor and General Assembly change re-benchmarking policies to reduce state funding of K-12? • - HAC listed options at retreat to cut K-12 funding. • What will the Governor propose for public retirement costs? • - HAC defended use of 8% rate-of-return versus VRS Board 7%. • Will policies be proposed to bend the Medicaid cost curve? • Will the $60 million aid-to-locality reductions continue? • Will Aid-to-Police (HB 599) increase with GF revenue growth? • Were lower FY 2011 CSA expenditures a one-time event? Will additional state savings policies be proposed? • Will devolution changes be proposed for transportation maintenance funding? • Will General Assembly make BPOL/M&T tax changes without replacement revenue? 21
Locals Already Help Support State Transportation System • FY 2010 local street maintenance expenditures exceeded state payments by 33% or $113 million.* • Total FY 2010 local expenditures for highways exceeded $365 million, not including toll revenue, and debt service for transportation project bonds.* • Local funds supporting public transportation amounted to $264 million in FY 2010, not including $316 million in farebox and other transit revenue. ** * FY 2010 Weldon Cooper Road, Street, and Highway Finance Survey ** Dept. of Rail and Public Transportation
There is Wide Variation in Local Reliance on BPOL and M&T Taxes (Both in terms of percent of revenue and absolute dollars) 23 Source: FY 2010 Auditor of Public Accounts Comparative Report of Revenues and Expenditures
Local Government Budgets Trying to Hold On Until Better Days Arrive * 83 localities responding to VML/VACO Survey 24 24
More Localities Fear the Future* * Results from 2011 VML/VACO survey 25 25
Conclusion • Without new revenues and expecting modest economic growth, state will continue to reduce funding for locally-administered, but required programs in 2012-14 budget. • - Medicaid and VRS demands will outstrip GF revenue growth, putting pressure on state funding for other core programs. • - Rainy Day Fund must be replenished and other one-time revenue sources are exhausted. • State increasingly relies on funding sources other than state taxes for programs (federal revenue, local funding, higher ed tuition & fees). • - State has reduced its own tax base. • - Pushing program funding to feds, locals, and students will get more difficult due to federal deficit, ongoing housing crisis, and already high college tuitions. • Governor’s request for 2%, 4%, and 6% agency budget reduction plans, and his Task Force for Local Government Mandate Review reflect realities of lower funding. • State will be tempted to continue shift more responsibilities to local government, despite real estate recession (e.g., transportation devolution). • - How would this shift fit with reducing local revenues such as BPOL/M&T?