Download
1 / 1
10 likes | 130 Views
Modeling of the geomagnetic field at the core surface from historical data. Bryan Grob, Institute for Geophysics, ETH Zurich, 8092 Zurich, Switzerland, bgrob@student.ethz.ch. 1. Introduction and Aims

E N D
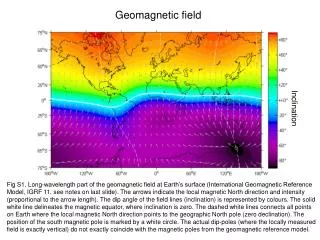
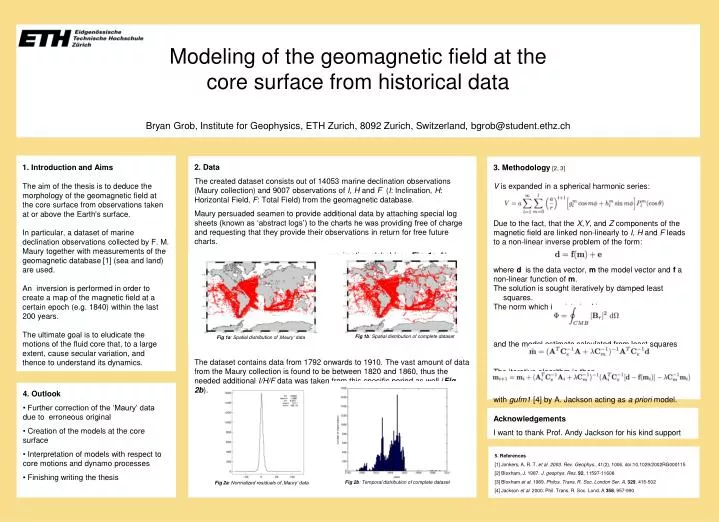
Modeling of the geomagnetic field at the core surface from historical data Bryan Grob, Institute for Geophysics, ETH Zurich, 8092 Zurich, Switzerland, bgrob@student.ethz.ch 1. Introduction and Aims The aim of the thesis is to deduce the morphology of the geomagnetic field at the core surface from observations taken at or above the Earth's surface. In particular, a dataset of marine declination observations collected by F. M. Maury together with measurements of the geomagnetic database[1] (sea and land) are used. An inversion is performed in order to create a map of the magnetic field at a certain epoch (e.g. 1840) within the last 200 years. The ultimate goal is to eludicate the motions of the fluid core that, to a large extent, cause secular variation, and thence to understand its dynamics. 2. Data The created dataset consists out of 14053 marine declination observations (Maury collection) and 9007 observations of I, H and F (I: Inclination, H: Horizontal Field, F: Total Field) from the geomagnetic database. Maury persuaded seamen to provide additional data by attaching special log sheets (known as ‘abstract logs’) to the charts he was providing free of charge and requesting that they provide their observations in return for free future charts. Hence the data distribution is in first approximation global (see Fig. 1a, b): The dataset contains data from 1792 onwards to 1910. The vast amount of data from the Maury collection is found to be between 1820 and 1860, thus the needed additional I/H/F data was taken from this specific period as well (Fig. 2b). 3. Methodology [2, 3] V is expanded in a spherical harmonic series: Due to the fact, that the X,Y, and Z components of the magnetic field are linked non-linearly to I, H and F leads to a non-linear inverse problem of the form: where dis the data vector, m the model vector and f a non-linear function of m. The solution is sought iteratively by damped least squares. The norm which is minimized is and the model estimate calculated from least squares The iterative algorithm is then with gufm1 [4] by A. Jackson acting as a priori model. Fig. 2: Mars crustal magnetism Fig. 1: Mars Global Surveyor (MGS) Fig 1b: Spatial distribution of complete dataset Fig 1a: Spatial distribution of ‚Maury‘ data • 4. Outlook • Further correction of the ‘Maury’ data due to erroneous original • Creation of the models at the core surface • Interpretation of models with respect to core motions and dynamo processes • Finishing writing the thesis Acknowledgements I want to thank Prof. Andy Jackson for his kind support 5. References [1] Jonkers, A. R. T. et al. 2003. Rev. Geophys., 41(2), 1006, doi:10.1029/2002RG000115 [2] Bloxham, J. 1987. J. geophys. Res. 92, 11597-11608 [3] Bloxham et al. 1989. Philos. Trans. R. Soc. London Ser. A, 329, 415-502 [4] Jackson et al. 2000. Phil. Trans. R. Soc. Lond. A 358, 957-990 Fig 2b: Temporal distribution of complete dataset Fig 2a: Normalized residuals of ‚Maury‘ data