Download
1 / 32
320 likes | 391 Views
Preview: Results from Analysis of Run 11 Transverse Asymmetries at 500 GeV. Steve Heppelmann Penn State. To be done: Improve time LED drift compensation (Yux1) %80 completed Improve Shower Shape (Saraj) 60% completed

E N D
Preview: Results from Analysis of Run 11Transverse Asymmetries at 500 GeV Steve Heppelmann Penn State • To be done: • Improve time LED drift compensation (Yux1) %80 completed • Improve Shower Shape (Saraj) 60% completed • Smooth out calibration (improve marginal cell callibration) Chris 50% (see talk) • Simulation Thomas, Alan, Me 10%
From Len’s Analysis, • Single Photon peak changes little with Energy • Single peak at SigmaMax~.5 • Two Photon peak moves toward the Single photon peak as energy increases • Double SigmaMax Peak • 38 GeV <SigmaMax>~.85 • 73 GeV <SigmaMax>~.75 35-40 GeV 70-75 GeV
Geant4 Simulation 70-80 GeV Single Cluster Events. • N =1870 • N chi2(photon)<5 && chi2(pi0)<5=488 (33%) • N Clear pi0 = 460 (30%) • N Clear Single Photon = 540 (37%) Clear pi0 Clear Single Photon 4
Sigma Max for the 67% of events that have well separated pi0 and single photon. Using the “one cluster” events (70 to 80 GeV) from the previous page: We now look at “Len’s Sigma Max” variable that is used to categorize Clusters. In the figures below, the “Sigma Max” distributions are shown. The red represents events with chi2(pi)>5 && chi2(gamma)<5. The black represents events with chi2(pi)<5 && chi2(gamma)>5. Clear Single Photon Clear pi0 5
Run 11 distributions of SigmaMax as a indicator of single photon vs pi0 only slowly degrades with higher energy. 60 GeV 80 GeV 110 GeV 150 GeV
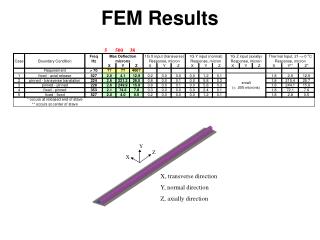
Model 1 • This is a study of a Geant4 based model of a 7x7 Small Cell • FPD type detector. • In the following presentation • The signal is modeled both as energy deposited in cells and simultaneously as Number of Cerenkov produced in the cell and detected at the photo cathode • Simulation involves a single photon directed in the center of the center cell of a 7x7 array of cells. The cells are arranged with their long axis along the z axis and the photon momentum is in the z direction. • The detected Cerenkov signal is reduced from the number of produced Cerenkov by three factors • Photocathode efficiency as a function of photon energy • Absorption length of glass as a function photon energy • Reflectivity of Cell surfaces as a function of energy. Cathode Eff Absorption Len (cm) reflectivity
Number of Generated Cerenkov Photons ~ 70000 Photons/GeV Independent of Photon Energy Number of Detected Cerenkov Photons 600 to 800 Photons/GeV 30% CHANGE IN NUMBER for Energy from 4 to 60 GeV
50 GeV<Epair<70GeV 30 GeV<Epair<50GeV 90 GeV<Epair<110 GeV 70 GeV<Epair<90GeV 130 GeV<Epair<150GeV 110 GeV<Epair<130GeV
50 GeV<Epair<70GeV 30 GeV<Epair<50GeV 90 GeV<Epair<110 GeV 70 GeV<Epair<90GeV 130 GeV<Epair<150GeV 110 GeV<Epair<130GeV
Raw AN vs Cos(Phi) Distributions for yellow and blue beams (colors indicate beams) Left: pi0 events (3.5<Y<3.9) && (45 GeV< Epair<95 GeV) <raw AN(blue)>=1.16% +/- 0.07% <raw AN(yellow)>=-0.04% +/- 0.07% Right: Single Photon events (2.6<Y<4.1) && (45 GeV< Epair<95 GeV) <raw AN(blue)>=0.76% +/- 0.03% <raw AN(yellow)>=-0.01% +/- 0.03%
The rest of these slides will display Blue Beam Single Spin Asymmetries. Cross Ratios are calculated using definitions of Left and Right with • All SSA that follow are calculated using • High Threshold Jet Trigger • ~250 Runs in day 79-98 range • Blue Beam • Pol ~ 0.5 • |Cos(Phi)|>0.5 (<|Cos(Phi)|>=0.8
Raw Asymmetry of 1 and 2 photon events vs run set number: (Run 11: day 79 – day 98) • Selection Cuts: • abs(Eta-3.3)<.7 • && ( (N12==1) || (abs(M12-.135)<.09 && N12==2) ) • && abs(E12-70)<25 Raw Asymmetry (Blue) for 1 & 2 photon events 0 Outputset079a.root 1 Outputset079b.root 2 Outputset079c.root 3 Outputset080a.root 4 Outputset080b.root 5 Outputset080c.root 6 Outputset081a.root 7 Outputset081b.root 8 Outputset082a.root 9 Outputset083a.root 10 Outputset083b.root 11 Outputset083c.root 12 Outputset083d.root 13 Outputset084a.root 14 Outputset084b.root 15 Outputset085a.root 16 Outputset086a.root 17 Outputset086b.root 18 Outputset086c.root 19 Outputset087a.root 20 Outputset087b.root 21 Outputset087c.root 22 Outputset088a.root 23 Outputset088b.root 24 Outputset088c.root 25 Outputset089a.root 26 Outputset090a.root 27 Outputset090b.root 28 Outputset090c.root 29 Outputset091a.root 30 Outputset091b.root 31 Outputset091c.root 32 Outputset091d.root 33 Outputset092a.root 34 Outputset092b.root 35 Outputset092c.root 36 Outputset093a.root 37 Outputset093b.root 38 Outputset093c.root 39 Outputset093d.root 40 Outputset094a.root 41 Outputset094b.root 42 Outputset095a.root 43 Outputset095b.root 44 Outputset096a.root 45 Outputset096b.root 46 Outputset096c.root 47 Outputset097a.root 48 Outputset097b.root 49 Outputset098a.root 50 Outputset098b.root Data Reanalyzed at PSU 8-12-11 through 8-17-11 - Improved day 95 based calibration - LED Corrections with small cell LED recalibration on daily basis - Turn on SigmaMax based single cluster analysis (categories 0-2). Pion/Single Photon analysis based on Red Sets Eta analysis based on all sets (~300 runs)
Left: Two Photon Energy Distribution for (M12<2 && abs(Eta-3.7)<.2 && N12==2) &&Z<.7) (Photons collected independently within .07 radians ) Right: Cosine Azimuthal Angle Distribution For (above cuts && abs(M12-.135)<09 ) Average angle for AN events = <Cos(Phi)=0.795
A guess might be that Asymmetries will be similar at 500GeV to 200 GeV when • plotted against XF and PT . • For Asymmetric (forward) parton collisions, • XF reflects the momentum fraction of the forward parton. • PT reflects the inverse of the distance scale over which parton trajectories • scatter coherently (in Phase). • Higher twist means more partons squeezed into a distance scale 1/ PT . • Higher twist amplitudes fall with additional factors of 1/ PT reflecting the geometric improbability of finding more partons within a smaller and smaller transverse region. • If Asymmetries don’t fall with factors 1/ PT it implies • Leading Twist physics (violating helicity conservation and inconsistent with known phases of leading twist processes) • Non-perturbative effects like scattering in a classical background field. • The PT dependence of Asymmetries is extremely important in unraveling the nature of forward spin physics.
Yield (top row) and Single Spin Transverse Asymmetry (bottom row) vs Pt and Energy. Pt dependence for 50 GeV<E12<90 GeV . Single Photon (blue) Pi0 (red) AN vs PT AN vs PT AN vs E
Yield (top row) and Single Spin Transverse Asymmetry (bottom row) vs Pt and Energy. Pt dependence for 90 GeV<E12<130 GeV . Single Photon (blue) Pi0 (red) AN vs PT AN vs PT AN vs E
Yield (top row) and Single Spin Transverse Asymmetry (bottom row) vs Pt and Energy. Pt dependence for 130 GeV<E12<150GeV . Single Photon (blue) Pi0 (red) AN vs PT AN vs PT AN vs E
Energy Dependenced of AN for selected Pi0 0 0.2 0.4 0.6 0.8 XF
Compare XF Dependence: Run 11 (500 GeV) 2.6<Eta<4.0 s=500 GeV to Run 6 (200 GeV) <Eta>=3.3 s=200 GeV 0 0.2 0.4 0.6 0.8 XF
Compare XF Dependence: Run 11 (500 GeV) 2.6<Eta<4.0 s=500 GeV to Run 6 (200 GeV) <Eta>=3.7 s=200 Gev 0 0.2 0.4 0.6 0.8 XF
Compare PT Dependence: Run 11 (.2<XF<.36) to Run 6 (<XF>=.28)
Compare PT Dependence: Run 11 (.36<XF<.52) to Run 6 (<XF>=.43)
Compare PT Dependence: Run 11 (.52<XF<.68) to Run 6 (<XF>=.6)
ANvs Two Photon Energy for Eta Mass (.35 GeV< Mpair < .75 GeV) 3.45<Eta<3.85
ANvs Two Photon Energy for Eta Mass From Run 11 500 GeV 3.45<Eta<4.05 0 0.2 0.4 0.6 0.8 XF From Run 6 200 GeV Eta~ 3.68 (Center Cut)
ANvs Two Photon Mass 100 GeV< Epair < 140 GeV 3.45<Eta<3.85 From Run 11 500 GeV .4<XF<.56
ANvs Two Photon Mass 100 GeV< Epair < 140 GeV 3.45<Eta<3.85 From New Eta Paper 200 GeV XF>.4 From Run 11 500 GeV .4<XF<.56
ANvs Two Photon Mass 200GeV < Epair < 250 0. 0.2 0.4 0.6 0.8 1.0 1.2 1.4 1.6 1.8 2.0 Mass (GeV) -0.5 0.0 0.5 1.0 0. 0.2 0.4 0.6 0.8 1.0 1.2 1.4 1.6 1.8 2.0 Mass (GeV)
Conclusion: • The separation of 0 from single photons is consideredUp to 100 GeV, sigmamax separation is fairly good. • Above 100 GeV, some mixing occurs but enriched 0 and single photon signals can still be produced. More study of this is needed. • 500 GeV 0 measurements cover a similar XF as that from Run 6 but in a higher PT region. • For XF <.4 the 500 GeV SSA’s are larger than at 200 GeV. • For XF >.4 the 500 GeV SSA’s are smaller than at 200 GeV. • The 500 GeV 0 SSA is fairly constant (or slowly falling) in PT out to PT of 10 GeV/c. • Extracting single photon may be possible with more work on shower shape. • More work is needed for Eta meson asymmetry but the XF dependence of AN may be similar to that found in our new 200 GeV measurement.