Download
1 / 13
130 likes | 239 Views
DOW Imagery Overlay. George Krauszer Uriah Burhans. Abstract.

E N D
DOW Imagery Overlay George Krauszer Uriah Burhans
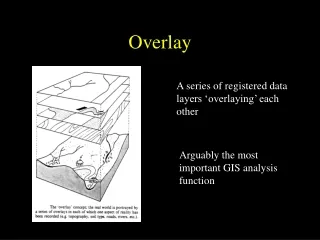
Abstract • Using DOW data gathered on February 8th, 2011 in Richford, VT, scan images of Reflectivity, ZDR, and Velocity loaded into SOLOII will be imported into ArcCatalog. We will use ArcMap and ArcCatalog to turn our images into shapefiles that are scaled and set to a coordinate system. This will allow us to overlay the images onto road, political, and elevation maps in ArcMap and allow for further investigation and studying of the scan data.
DOW Imagery Collect and import the images from the LSC server into SOLOII Using Reflectivity, Velocity, and ZDR scan images Time of images is 19:14:11 (02/08/11) -most active velocity data time Elevation angle is 3.7 degrees
Set up and Statistics First we build statistics in ArcCatalog Next we set coordinate systems -WGS NAD84 Zone 18N
Background and Buffer Import in boarders and roads from VCGI The Border and Road shapefiles use NAD83 StatePlane (Vermont), which is not the same as our images Determine our Epicenter 45.006N, 72.687W Set a Grid and Buffer around the Epicenter--we want a 30KM Buffer
Reclass Needed to Reclass our DOW images Make image color values match the image color bar Match old values with ‘new’ values Use the Reclassify tool Located under the Reclasstoolbox in the Spatial Analyst Tools toolbox Apply appropriate color schemes for images
Cropping Need to take off the color bar on the bottom of the Reclassified image Need to create a rectangle polygon ArcCatalog Make a shapefile Move the shapefile into Arcmap
More Cropping! Now that we have our rectangle, move it over the section of the image we want to keep EDITTING TIME! Open Editor and Start Editing Extraction tool box Define area of extraction as that of the rectangle Extract Now we have the image that we want
Georeferencing Georeference our new reclassified images to our DOW epicenter and map Fit image to display, then ‘snap’ the image Center of image snaps to epicenter, then snap the 30KM range-ring on the image to the 30KM buffer Once snapped, the image must be ‘rectified’ using the Rectify tool in Georeferencing
Final product Values on the left are dBz for the reflectivity scan shown Derby Line Burlington LSC
Added Features Slope shape file added to show terrain location(VCGI)
Velocity Scan The Jay’s