Download
1 / 29
290 likes | 300 Views
THE NIST SANS USER RESEARCH. SANS RESEARCH TOPICS Boualem Hammouda National Institute of Standards and Technology Center for Neutron Research. 1. SANS from Pluronics 2. Polymer Blend Thermodynamics 3. Helix-to-Coil Transition in DNA. 1. SANS FROM PLURONICS.

E N D
SANS RESEARCH TOPICSBoualem HammoudaNational Institute of Standards and TechnologyCenter for Neutron Research 1. SANS from Pluronics 2. Polymer Blend Thermodynamics 3. Helix-to-Coil Transition in DNA
1. SANS FROM PLURONICS Pluronics are triblock copolymers: PEO-PPO-PEO PEO: -CH2CH2O- is hydrophillic PPO: -CH2CH2(CH3)O- is hydrophobic
GUINIER PLOT I(Q) = I(0) exp(-Q2Rg2/3) Guinier region Guinier region
SANS from Pluronics Micelles PPO PEO PEO PEO PEO low temperature high temperature Polymer Sphere Sphere and polymer PPO PPO
SINGLE PARTICLE AND INTER-PARTICLE STRUCTURE FACTORS I(Q)=(NA/V)VA2(bA/vA-bB/vB)2P(Q)S(Q) NA: number of particles, VA: particle volume, V: sample volume (bA/vA-bB/vB)2=contrast factor P(Q): single-particle structure factor S(Q): inter-particle structure factor P(Q) = [F(QR)]2 = 3[sin(QR)/(QR)3-cos(QR)/(QR)2]2 for sphere of radius R. P(Q) = 2[exp(-Q2Rg2)-1+Q2Rg2]/(Q2Rg2)2 for polymer of radius of gyration Rg. S(Q) given by Percus Yevick model for solution of hard spheres. S(Q) given by the Random Phase Approximation model for polymer mixtures.
Solution of Spheres Percus Yevick Model Solution of spheres Single sphere
Solution of Spheres with Polymers PPO PPO PPO PPO PPO PEO PEO PEO PEO PEO PEO PEO PEO PEO PEO
10% P85 Pluronic/D2O, 40 oC solvent region C shell region B In the core: 2,795 PPO monomers 690 PEO monomers 490 D2O molecules core region A In the shell: 2,943 PEO monomers 34,167 D2O molecules (b/v)C = 6.4*10-6 Å-2 (b/v)B = 5.9*10-6 Å-2 (b/v)A = 1*10-6 Å-2 RA=42.6 Å RB=71.4 Å Fit SANS Data to a Model of Concentrated Core-Shell Particles
2. POLYMER BLENDS THERMODYNAMICS SANS Intensity: I(Q) = dS(Q)/dW = (b1/v1-b2/v2)2 ST(Q) Thermodynamics: ST-1(Q=0) = (1/kBT)(d2G/df12); G: Gibbs Free Energy. The Random Phase Approximation: ST-1(Q) = 1/(n1f1v1P(QRg1) + 1/(n2f2v2P(QRg2) -2 c12(T)/v0 Mixed polymer blend Phase separated blend 1 nm 0.1 mm
SANS FROM POLYMER BLEND MIXTURES Polymers: Polyethylbutylene / Polymethylbutylene hPEB -(C6H12)- / dPMB -(C5H5D5)- Molecular Weights: Mw=44,100 g/mole Mw=88,400 g/mole Volume Fractions: fhPEB=0.57 fdPMB=0.43
1 nm 0.1 mm
THE DNA MOLECULE Amine bases Phosphate group Sugar Purines Pyrimidines H H N O H H3C N N N H N N O H H N HOCH2 OH O H H O H H Adenine (A) Thymine (T) H H O O P HO H O H H D-desoxyribose O N H N N N H H N N H N O N H H H Guanine (G) Cytosine (C) Nucleotide H H N H N Base O H O N O Phosphate group P O CH2 O Sugar O C C H H H H C C H HO 3. HELIX-TO-COIL TRANSITION IN DNA DNA is the basic building block for life. It encodes for the synthesis of proteins.
THE DNA HELIX T A G Major groove A T Pitch 30-40 Å T A A T G C A Minor groove C A C G Repeat distance per base pair=3.4 Å A
NONLINEAR LEAST-SQUARES FIT Functional form: I(Q) = C/[1+(QL)m] + Background C: solvation intensity L: correlation length m: Porod exponent
12.3 Å 12.3 Å 8.5 Å 8.5 Å Correlation Length
Porod Exponent Reference: B. Hammouda and D. Worcester, “The DNA Denaturation Transition of DNA in Mixed Solvents”, Biophysical Journal (accepted 2006).
POROD EXPONENTS Porod region 1D object 2D object 3D object 1/Q1 1/Q2 1/Q4 1/Q1.67 1/Q2 1/Q3 1/Q3 1/Q4 MASS FRACTALS SURFACE FRACTALS
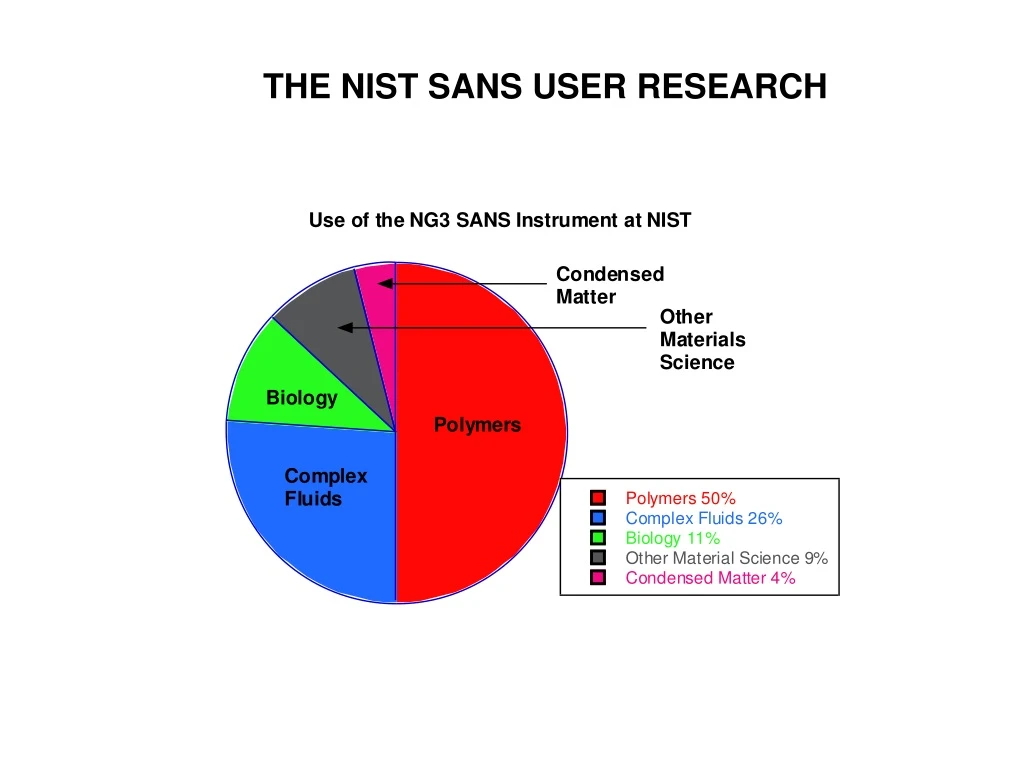
CONCLUSIONS -- The SANS technique is a valuable characterization method. -- SANS has been effective in complex fluids, polymers,biology, etc. -- SANS can determine structures, phase transitions, and morphology. -- The NG3 SANS instrument at NIST gets over 150 users per year, resulting in over 40 publications per year. ACKNOWLEDGMENTS NSF-DMR, Steve Kline, Nitash Balsara, David Worcester. CHECK IT OUT: http://www.ncnr.nist.gov/programs/sans/ http://www.ncnr.nist.gov/staff/hammouda/ hammouda@nist.gov