Download
1 / 19
190 likes | 277 Views
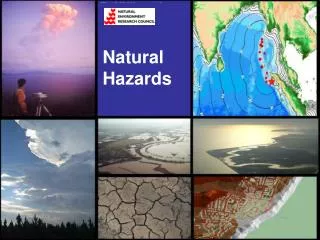
Identifying natural hazards in climate databases. Albert Klein Tank KNMI, the Netherlands 19 September 2002 acknowledgements : Lisa Alexander (Met Office, UK) Janet Wijngaard, Aryan van Engelen & Günther Können (KNMI) 36 ECA-participants (Europe & Middle East). European Study:

E N D
Identifying natural hazardsin climate databases Albert Klein Tank KNMI, the Netherlands 19 September 2002 acknowledgements:Lisa Alexander (Met Office, UK) Janet Wijngaard, Aryan van Engelen & Günther Können (KNMI) 36 ECA-participants (Europe & Middle East)
European Study: http://www.knmi.nl /samenw/eca
River Rhine flooding 1995; precipitation data GPCC (GPCC, 1995)
Recent Elbe flooding 2002; precipitation data (GPCC, 1995)
NO NO Studying trends: what types of extremes? • Trends in extreme events characterised by the size of their societal or economic impacts • Trends in “very rare” extreme events analysed by the parameters of extreme value distributions • Trends in observational series of phenomena with a daily time scale using indices of extremes YES
Motivation for choice of “extremes” • The statistical detection probability of trends depends on the return period of the extreme event and the length of the observational series • For extremes in daily series of e.g. temperature and precipitation having typical length ~50 yrs, the optimal return period is 10-30 days rather than 10-30 years
example: 80% detection prob. (5%-level) T (see also: Frei & Schär, J.Climate, 2001) N
Approach • Using derived climate indices as proposed by the joint CCL/CLIVAR Working Group on Climate Change Detection (Peterson et al., WMO-TD No. 1071, 2001) • Focus on counts of days crossing a threshold; either absolute/fixed thresholds or percentile/variable thresholds relative to local climate • Standardisation enables comparisons between results obtained in different parts of the world(e.g. Frich et al., Clim. Res. 2002; also in IPCC-TAR)
Temperature indices I • Example of “frost days” as an extreme index based on an absolute temperature threshold
Temperature indices II • Example of winter “warm spells” and “cold spells” as an extreme index based on counts of events over a (seasonally varying) percentile threshold
Precipitation indices I • Example of “R95%tot” extreme index for the precipitation fraction due to very wet days
Easterling et al. (BAMS, 2000) in IPCC-TAR see also Groisman et al. (Clim.Change, 1999) Linear trends in rainy season over ~50 years