Download
1 / 36
380 likes | 517 Views
WV images, Potential Vorticity and Conceptual Models. Nuno Moreira (nuno.moreira@meteo.pt) Instituto de Meteorologia, Lisboa, Portugal 2003. W V images - Characteristics. Water Vapour absorption band : 6 - 7 WV Meteosat channel WV 6.2 (5.35 - 7.15 ) from MSG

E N D
WV images, Potential Vorticity and Conceptual Models Nuno Moreira (nuno.moreira@meteo.pt) Instituto de Meteorologia, Lisboa, Portugal 2003
WV images - Characteristics • Water Vapour absorption band : 6 - 7 • WV Meteosat channel • WV 6.2 (5.35 - 7.15 ) from MSG • WV 7.3 (6.85 – 7.85 ) from MSG • Water vapour absorbes Infra-Red radiation emmited by the earth surface and lower clouds • WV image is “constructed” from the re-emission by water vapour
WV images - Characteristics • “The instrument measures the humidity temperature” • “Topography of water vapour emission” • Gray shades • Light gray – humidity in the troposphere upper levels • Dark gray - humidity in the troposphere lower levels
Regions of emission • R.H. =100% -> 250 hPa - 550 hPa (max: 350 hPa) • R.H. = 50% -> 250 hPa - 600 hPa (max: 400 hPa) • R.H, = 25% -> 250 hPa - 700 hPa (max: 450 hPa) (Bader et al, 1995)
Regions of emission • Bader et al (1995)
Water Content in the troposphere • 48.7 % of total water content – below 850hPa • 77.5% of total water content - below 700hPa • 92.5% of total water content - below 550hPa (NOAA, 1991)
WV Imageand tropospheric levels • Light areas – white / light gray • Humidity in upper levels • Medium and lower levels ? • Dark areas – black/ dark gray • Low humidty in upper levels • Higher humidity content in medium levels • Lower levels ?
Fenomena retrieved from water vapour imagery • Tropopause folding • Jet streams/streaks • Vorticity Advection • Rapid cyclogenesis (bombs) (?) • Troughs and ridges in upper levels • Cut-off lows
Related meteorological parameters • Geopotential (eg. 300 hPa) • Wind field (eg. 300 hPa) • Potencial Vorticity • Tropopause Map
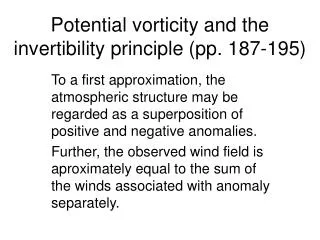
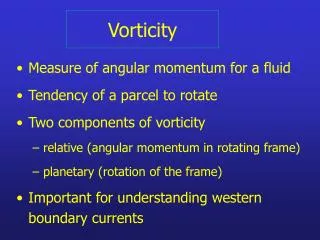
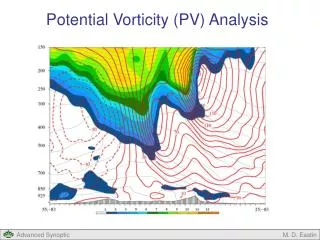
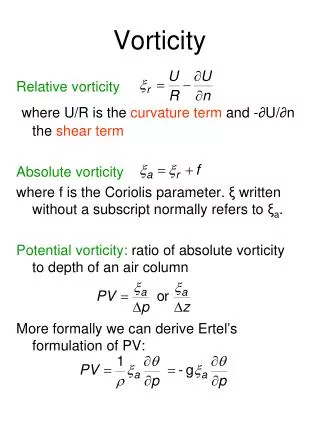
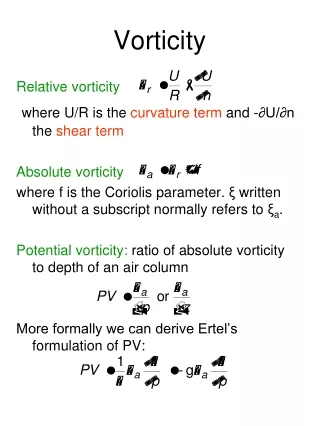
Potential Vorticity • Potential Vorticidade in isentropic levels (constant potential temperature ) • Absolute Vorticity (planetary + relative) and static stability • Tropospheric air mass – low (I)PV • Stratospheric air mass – high (I)PV
Potential Vorticity • Dynamic Tropopause = 1.5 <-> 3.0 UVP • Advantages of Isentropic Potential Vorticity (IPV) • Conservative property over a conservative surface • Superposition with wind field depicts temporal evolution of Potential Vorticity • However, PV can also be depicted in pressure levels !!
Tropopause Map • Topography of the Tropopause (isentropic coordenates, isobaric, geopotencial) • low -> low Tropopause • high -> high Tropopause • Advantage • Quantifies lowest tropopause level
The definiton … • Jet stream • Upper Tropospheric wind speed > 60 kt • Jet streak (= Jet Stream maximum) • “wind speed maximum situated along the axis of a jet stream at the level of maximum wind” (Palmén and Newton, 1969)
Jet Stream – vertical section • Keyser and Shapiro (1986)
Jet Stream – vertical section • Holton (1992)
Jet Stream – vertical section • Met. Office (1997)
Jet Relative Vorticity North H.: cyclonic side – Positive Relative Vorticity South H. : cyclonic side – Negative Relative Vorticity • “Manual of Synoptic Satellite Meteorology–Conceptual Models, v3.0”, ZAMG/KNMI/FMI/EUMETSAT
Jet Vorticity advections PVA- Positive Vorticity Advection NVA - Negative Vorticity Advection • “Manual of Synoptic Satellite Meteorology–Conceptual Models v3.0”, ZAMG/KNMI/FMI/EUMETSAT
Jet Ageostrophic Wind Vertical motion • Keyser and Shapiro (1986)
Jets and Fronts • Bluestein (1993)
Cut-offlows • Elizaga et al (1996)
Lowering Tropopause ----> Vertical Motion • Elbern et al (1998) 15Oct93
Lowering Tropopause ----> Vertical Motion • Romero (2000) 28 Sep 94
And ... • Malardel (2000)
.. Related NEW proposed symbols .. • Adapted from Joly and Santurette (2000)
References • Bader, M.J., Forbes, G.S., Grant, J.R., Lilley, R.B. e Waters, A.J., 1995: Images in weather forecasting. Cambridge University Press, Cambridge, 499 pp. • Bechtold, P., 2000: Atmospheric moist convection: effects, concepts and modelling/forecast. Módulo do Curso “Weather forecasting in the midlatitudes” realizado na MeteoFrance de 4-15 Dezembro 2000 [ver relatório VAP01/01, Instituto de Meteorologia] • Bluestein, H.B., 1993: Synoptic-Dynamic Meteorology in Midlatitudes, Vol.II: Observations and Theory of Weather Systems. Oxford University Press, Oxford, 594 pp. • Boyle, J.S. e Bosart, L.F., 1986: Cyclone-Anticyclone couplets over North America. Part II: Analysis of a major cyclone event over the Eastern United States. Mon. Wea. Rev., 114, 2432-2465. • Elbern, H., Hendricks, J. e Ebel, A., 1998: A climatology of tropopause folds by global analysis. Theor. Appl. Climatology, 59, 181-200. • Elizaga, F., Martin, F., Riosalido R., Carretero, O., Elvira, B. e Garcia, A., 1996: Imágenes de vapor de agua: uso en el diagnostico de niveles altos. IV Simposio Nacional de Predección. Memorial “Alfondo Ascaso”, Madrid, 15-19 Abril 1996, INM. • Grahame, N., 1998: Christmas Eve storm. Review of interesting synoptic cases. Fourth Meeting of the Working Group on Cooperation between European Forecasters (WG CEF). Set. 98 Comunicação oral. • Hirschberg, P.A. e Fritsch, J.M., 1991b: Tropopause ondulations and the development of extratropical cyclones - Part II: Diagnostic Analysis and coceptual model. Mon. Wea. Rev., 119, 518-550. • Hoskins, B.J., McIntyre, M.E. e Robertson, A.W., 1985: On the use and significance of isentropic potencial vorticity maps. Quart. J. Roy. Meteo. Soc., 111, 877-946. • Joly, A e Santurette, P., 2000: Turning dynamical ideas into forecast practice: a proposal for a renewed graphic summary of the synoptic scale situation. Centre National de Recherches Météorologiques, Service Central d´Exploitation Météorologique. Módulo do Curso “Weather forecasting in the midlatitudes” realizado na MeteoFrance de 4-15 Dezembro 2000 [ver relatório VAP01/01, Instituto de Meteorologia]
References • Keyser, D. e Shapiro, M.A., 1986: Review – A review of the structure and dynamics of upper-level frontal zones. Mon. Wea. Rev., 114, 452-499. • Malardel, S., 2000: Weather forecasting in midlatitudes regions - Large scale dynamics in the midlatitudes. Módulo do Curso “Weather forecasting in the midlatitudes” realizado na MeteoFrance de 4-15 Dezembro 2000 [ver relatório VAP01/01, Instituto de Meteorologia] • Moreira, N., 1999: Utilização de imagens de vapor de água na avaliação de campos previstos por Modelos numéricos. Instituto de Meteorologia. • Morgan,M.C. e Nielson-Gammon, 1998: Using tropopause maps to diagnose midlatitude weather systems. Mon. Wea. Rev., 126, 2555-2579. • NOAA, 1991: Water vapor imagery – Interpretation and applications to weather analysis and forecasting. NOAA Technical report NESDIS 57, National Oceanic and Atmospheric Admnistration, Washington, 213 pp. • Prates, F., 1996: Utilização de cartas de vorticidade potencial isentrópica no diagnóstico dos processos de ciclogénese. Nota Técnica. Instituto de Meteorologia. • Romero, R., 2000: Sensitivity of a heavy rain producing Western Mediterranean cyclone to embedded potencial vorticity anomalies. Submetido ao Quarterly Journal of the Royal Meteorological Society. • Santurette, P., 1998: About new products and new methods for synoptic forecast in Meteo-France. Casos de estudo apresentados no curso sobre previsão na Meteo-France, Dez. 98. Comunicação oral. • ZAMG/KNMI/FMI/EUMETSAT, 2001: Manual of Synoptic Satellite Meteorology – Conceptual Models v3.0.