Download
1 / 16
160 likes | 174 Views
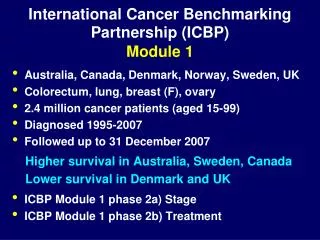
International Benchmarking. Mark Schneider American Institutes for Research IES Research Conference June, 2009. Two main purposes of international benchmarking. Comparison of performance League tables. 2007 TIMSS 8 th Grade Math.

E N D
International Benchmarking Mark Schneider American Institutes for Research IES Research Conference June, 2009
Two main purposes of international benchmarking • Comparison of performance • League tables
Benchmarking to Gauge Comparative Performance (effect sizes in math) US:Taipai = Mississippi:Massachusetts
Benchmarking to Learn more about Performance within the United States (effect sizes in math)
PISA v. TIMSS • PISA is a self-proclaimed “yield study” assessing the total “literacy” of 15 year olds. • Emphasis on globalization and 21st century skills • assessing the skills young adults will need in the emerging global economy. • TIMSS is more grade and curriculum centered . • designed to align broadly with mathematics and science curricula in the participating countries. • The results “suggest the degree to which students have learned mathematics and science concepts and skills likely to have been taught in school.”
Who Participates in These Assessments and Does it Matter? • PISA consists of every major trading partner and competitor of the U.S. • TIMSS is increasingly skewed toward less developed countries.
Differences in PISA/TIMSS results • In TIMSS 2007 eighth grade math students in the United States scored above the international TIMSS average. • In PISA 2006 US 15 year olds were 24 points below the OECD average math score • In TIMSS 2007, 3 times the percentage of US eighth grade students were in the top 10% compared to the international median. • In PISA 2006, only 1.3% of US students were in the highest proficiency level in 2006 PISA math • half the OECD average and in the same range as Greece, Mexico, Portugal and Turkey.
Policy Advice • “Identify policy solutions to U.S. education system shortcomings.” (NGA) • Two basic approaches • Statistical analysis • Best practices
Generating Policy Advice from International Assessments • OECD vs. IEA • Limits on the data • Cross sectional data • Measurement equivalence • Mixing statistical reports and policy • Policy advice built on weak data • Best practices
Next Frontier: State Participation in PISA or TIMSS • “Traditional approach” • 1000 or so students sit for the exam at a cost of $600,000-$750,000 per assessment
Limits to State Participation • How will international assessments fit into the already complex world of large scale assessments? • Can a state align its curricula to both NAEP and PISA? • Can PISA really inform policy makers about how to improve a state’s schools system? • Getting schools and students to take no- or low-stakes tests is increasingly difficult. • These tests are not cheap.
Are there cheaper ways of getting state scores? • Small Area Estimation • Statistical Linking—or how to save around $25 million. • The work of Gary Phillips is foundational
TIMSS Mean Scores Including Estimated Scores for Several American States (TIMSS)