Download

1 / 11
110 likes | 339 Views
Care New England Health System Statement of Operations Month of January 2013. Variance Actual Budget Fav/(Unfav) Total Revenue $ 73,752,563 $ 73,395,102 $ 357,461

E N D
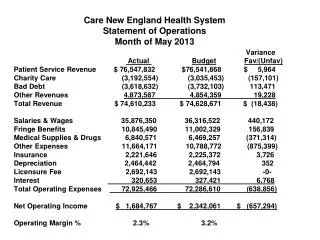
Care New England Health SystemStatement of OperationsMonth of January 2013 Variance Actual Budget Fav/(Unfav) Total Revenue $ 73,752,563 $ 73,395,102 $ 357,461 Salaries & Wages 35,365,080 36,966,576 1,601,496 Fringe Benefits 11,661,417 11,666,698 5,281 Medical Supplies & Drugs 6,980,630 6,432,290 (548,340) Other Expenses 11,606,374 10,610,506 (995,868) Insurance 2,199,139 2,225,396 26,257 Depreciation 2,464,442 2,464,794 352 Licensure Fee 2,692,142 2,692,142 -0- Interest 281,969 329,832 47,863 Total Operating Expenses 73,251,193 73,388,234 137,041 Net Operating Income $ 501,370 $ 6,868 $ 494,502
Care New England Health SystemStatement of OperationsYear-To-Date Fiscal Year 2013 Variance Actual Budget Fav/(Unfav) YTD YTD YTD Total Revenue $ 283,914,683 $ 286,729,198 $ (2,814,515) Salaries & Wages 143,092,587 146,446,576 3,353,989 Fringe Benefits 42,430,290 43,195,840 765,550 Medical Supplies & Drugs 25,632,993 25,478,270 (154,723) Other Expenses 45,007,438 44,602,775 (404,663) Insurance 8,790,564 8,900,091 109,527 Depreciation 9,839,107 9,859,173 20,066 Licensure Fee 10,768,570 10,768,570 -0- Interest 1,137,634 1,220,760 83,126 Total Operating Expenses 286,699,183 290,472,055 3,772,872 Net Operating Income $ (2,784,500) $ (3,742,857) $ 958,357 Operating Margin % (1.0%) (1.3%)
Women & Infants CorporationControllable ExpensesFor the Month of January 2013 Variance ActualBudgetFav/(Unfav) Total Net Revenue $ 36,959,473$ 36,970,333$ (10,860) Salaries 15,744,725 17,242,477 1,497,752 Medical Supplies 1,811,033 1,709,640 (101,393) Drugs 1,391,197 1,143,491 (247,706) Other Expenses: Consulting 118,721 165,422 46,701 Non-Medical Supplies 93,464 100,308 6,844 Purchased Services 1,702,178 1,652,487 (49,691) Maintenance Contracts 147,677 101,788 (45,889) Repairs & Maintenance 119,550 120,864 1,314 Food Costs 78,773 83,565 4,792 Rent Equipment 96,655 75,880 (20,775) Dues & Subscriptions 64,518 137,079 72,561 Travel & Education 44,768 108,298 63,530
Fiscal Year 2013 MetricsMonth of January 31, 2013 CNE (excludes VNA)Women & Infants January January Variance January January Variance ActualBudgetFav/(Unfav) ActualBudgetFav/(Unfav) Cost Per Adjusted Day $2,260 $2,399 5.8% $ 2,895 $ 3,005 3.7% Cost Per Adjusted D/C $11,486 $11,953 3.9% $11,175 $11,940 6.4% FTE’s Per Adj Occp Bed 4.78 5.30 9.7% 6.08 6.49 6.4% Salary Per FTE $ 78,424 $ 79,314 1.1% $80,008 $ 84,141 4.9% Total Cost Per FTE $104,431 $104,411 (0.02%) $ 108,604 $ 112,115 3.1% OT as a % of Paid dollars 6.7% / 4.3% 6.2% / 3.8%
Women & Infants CorporationControllable ExpensesFiscal Year-to-Date as of January 2013 Variance ActualBudgetFav/(Unfav) Total Revenue $ 145,101,138 $ 144,856,152 $ 244,986 Salaries 65,375,096 67,734,876 2,359,780 Medical Supplies 6,999,298 6,721,559 (277,739) Drugs 4,847,340 4,546,594 (300,746) Other Expenses: Consulting 472,636 661,688 189,052 Non-Medical Supplies 373,254 380,841 7,587 Purchased Services 6,552,027 6,617,281 65,254 Maintenance Contracts 550,162 465,163 (84,999) Repairs & Maintenance 496,881 482,046 (14,835) Food Costs 336,928 354,855 17,927 Rent Equipment 343,028 303,226 (39,802) Dues & Subscriptions 380,634 505,893 125,259 Travel & Education 277,112 418,874 141,762
Fiscal Year 2013 MetricsFiscal Year-to-Date January 31, 2013 CNE (excludes VNA) Women & Infants January January Variance January January Variance ActualBudgetFav/(Unfav) ActualBudget Fav/(Unfav Cost Per Adjusted Day $2,325 $ 2,411 3.5% $ 2,845 $ 2,977 4.4% Cost Per Adjusted D/C $ 11,702 $ 11,980 2.3% $11,388 $11,821 3.7% FTE’s Per Adj Occp Bed 4.90 5.13 4.5% 5.66 6.03 6.1% Salary Per FTE $ 81,525 $ 81,549 0.03% $88,800 $ 89,268 0.5% Total Cost Per FTE $ 105,779 $ 105,653 (0.12%) $ 116,653 $ 117,028 0.3% OT as a % of Paid dollars 6.5% / 4.5% 5.9% / 3.9%