Download
1 / 16
160 likes | 245 Views
WP5. Dynamics of supply-chain and market volatility of networks. Fernanda Strozzi Cattaneo University-LIUC Italy. WP5: Tasks overview. Coupling models Task5.5. EWDS of Blackouts T5.4. Electricity price Model T5.1. Interaction Risk T5.6. Electric power Model T5.1.

E N D
WP5 Dynamics of supply-chain and market volatility of networks Fernanda Strozzi Cattaneo University-LIUC Italy
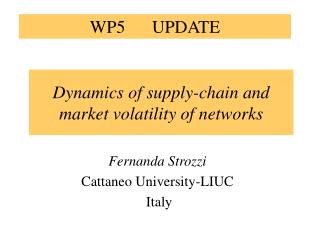
WP5: Tasks overview Coupling models Task5.5 EWDS of Blackouts T5.4 Electricity price Model T5.1 Interaction Risk T5.6 Electric power Model T5.1 Supply chain Model T5.1, T5.5 Correlations(T5.2) Analysis(T5.3) Energy spot prices Volatility Blackouts Volatility
Deliverables • D5.1. Report on supply-chain logical model by means of the Petri nets formalism (M12), completed. • D5.2. Report on market dynamics model (M12), completed. • D5.3. Report (paper) on Cross Recurrence Quantification Analysis between markets volatility and the dynamics of power systems dynamic (M24), 50% Done • D5.4.Report (paper) on coupled market dynamics - power systems- supply chains (M30) • D5.5. Report on early warning detection algorithm and suggestions on how implement it in real systems (M36) • EWDS developed for a one level supply-chain.
D5.1 (M12) Impact of the electric power supply on a logistic-production system Fault generation Model Monte Carlo One supply chain level Petri Net service level System Dynamic Model
D5.1Supply-Chain and electric model • Faults generation model: • Model of Medium Voltage (2400-34500 volts) Power Distribution System in Presence of faults and restoration events. • Monte Carlo Simulation to generate a Random Walk to simulate the faults. • Simulation of the protection device intervention and reconfiguration of the system. • System Dynamic logical model • Identification of the important variable in one supply chain level and their relationships. • Model of one supply chain level • Discrete model using Petri Net
D5.2 (M12)Electricity Markets and Spot Price Models • The available studies are classified in terms of the applied methodology . The proposed models can be broadly divided into three classes: • Statistical: technical analysis, simple autoregressive models. • Econometric: more sophisticate models with jumps, peak over the threshold • and regime switching. Other models are focused on price • volatility evaluation. • Structural fundamental methods, including the impacts of important • physical and economic factors on the spot price (Economic Cycles) • The available models are mostly either for univariate or uniequational analysis. • Not agreement on the models to utilize and on the main variables to be considered
D5.2 (M12)Electricity Markets and Spot Price Models Dynamic Factor Models Stock and Watson (2002a,b, 1999) • Factor Model (Principal Component): to identify latent (not measured)variables + Dynamical model (Dynamical Factor) to study the relationships between variables. • They can cope with many variables without running into scarce degrees of freedom. • They can manage large data set at a high disaggregate level. • They have not been explored for the electricity price dynamics
D5.2 (M12) Future Work Electricity price Factor Dynamic Model Fault generation Model Monte Carlo One supply chain level Petri Net ? Global service activity service level System Dynamic Model
D5.3 (M24) RQA analysis of electricity prices and blackout Recurrence Plots (RPs) represent the distance between state space points of a time series. RPs use state space reconstruction techniques (normally delayed vectors of only one measured variable) RQA extracts quantitative information from Recurrence Plots, in terms of several parameters: DET(%determinism), RR(% recurrence), LAM (laminarity) x t
D5.3 (M24) RQA parameters are able to distinguish between spot electricity prices dynamics and Gaussian linear correlated noise with the same autocorrelation function (the same FFT) RQA parameters gives a new measure of the dispersion of data (volatility) and dynamical information.
D5.3 (M24)RQA analysis of electricity prices and blackout [1] Application of non-linear time series analysis techniques to the Nordic spot electricity market data. F. Strozzi, E.Gutiérrez, C. Noè, T. Rossi, M.Serati and J.M. Zaldívar. LIUC Paper 200, october 2007. [2] Application of RQA to Financial Time Series, F. Strozzi, J.M. Zaldivar, J. Zbilut, Second International workshop on Recurrence Plot, Siena, 10-12 September 2007. [3] Measuring volatility in the Nordic spot electricity market using Recurrence Quantification Analysis. F. Strozzi, E.Gutiérrez, C. Noè, T. Rossi, M.Serati and J.M. Zaldívar . Submitted to Physica D
D5.5 (M36)Early Warning Detection System (EWDS) for Blackouts Divergence control • Divergence gives a filtered measure of the acceleration of the measured variable. • Divergence can be obtained analytically from the model of the system (the trace of its Jacobian). • Divergence can be reconstructed on-line using only one measured variable On-line Safety and optimization of chemical reactions controlling temperature to prevent runaway reactions On-line Trading startegy applied to high frequencies stock exchange better results than RSI (Relative Strenght Index)
D5.5 (M36) Early Warning Detection Algorithm for Blackouts Bullwip control in supply-chain application off-line and comparison with a proportional control D0 O1 D1=O0 Bullwhipi =var(Di)/var(Oi) [2] Strozzi, F., Zaldivar, J.M., Noè, C., 2007, The Control of Local Stability and of the bullwhip effect in a supply chain. International Journal of Production Economics (In press). [3] Caloiero, G., Strozzi, F., Zaldívar, J.M., 2007. A supply chain as a serie of filter or amplifiers of the bullwhip effect. International Journal of Production Economics (Accepted).
D5.5 (M36) Early Warning Detection Algorithm for Blackouts Bullwip control in supply-chain on-line application and comparison with a proportional control Cost reduction with the new control technique based on the divergence of the system in case of a periodic noisy demand [4] Strozzi, F., Noè, C., and Zaldivar, J.M. 2007, Control and on-line optimization of a supply chain. (In preparation).
LIUC Collaborations • Qeen Mary (Physica A) • JRC (Physica A, Physica D) • COLB (under discussion) • MASA (under discussion) LIUC Gender Action 2 female PhD students started to work on: • Models of Supply Chain • Ranking Risk in Supply Chain