Download
1 / 38
380 likes | 551 Views
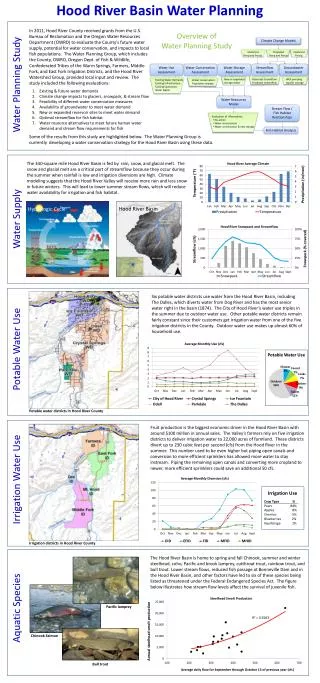
Hood River Basin Study Water Resources Modeling (MODSIM) Taylor Dixon, Hydrologist February 12, 2014. Water Resources Modeling: Metrics. Investigate potential relative changes to:. Quantity and timing of runoff at key locations Hood River at Tucker Bridge West Fork near Dee

E N D
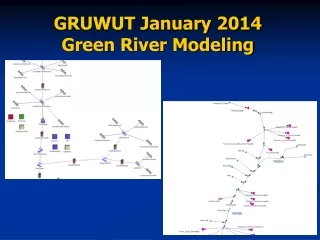
Hood River Basin Study Water Resources Modeling (MODSIM) Taylor Dixon, Hydrologist February 12, 2014
Water Resources Modeling: Metrics • Investigate potential relative changes to: • Quantity and timing of runoff at key locations • Hood River at Tucker Bridge • West Fork near Dee • Middle Fork above East Fork • East Fork above Middle Fork • East Fork below Main Canal • Green Point Creek • Neal Creek • Reservoir storage • Laurance Lake • Green Point reservoirs • Hydropower production • Cumulative by district • Consumptive use • Cumulative by district • Minimum flows • Locations specified in Water Use Assessment
Water Resources Modeling: Metrics Storage facility Irrigation district IFIM reach Minimum flow reach Hydropower plant Glacier
Water Resources Modeling: Climate Scenarios Adjustments in Precipitation and Temperature MW/D = more warming, dry condition MI = middle (or median) condition LW/W = less warming, wet condition comparing annual averages from 1980-2010 to projected averages during 2030-2060 MW/D LW/W MI 1980 - 2010
Water Resources Modeling: Alternatives • Baseline: historical flows, historical conditions • 1980 – 2009 period • Current storage facilities • Average water demands • Alternative 2: future flows, historical conditions • 2030 – 2059 period • Baseline storage facilities and demands • Alternative 3: future flows, increased demands • 2030 – 2059 period • Baseline storage facilities • Municipal demands scaled according to population growth • Agricultural demands scaled according to temperature (ET)
Water Resources Modeling: Alternatives • Alternative 4: future flows, increased demands, water conservation • 2030 – 2059 period • Baseline storage facilities • Alternative 3 municipal demands • Alternative 3 agricultural demands scaled according to projected conservation practices • Alternative 5: future flows, increased demands, water conservation, new storage • 2030 – 2059 period • Alternative 4 demands • Increased storage at existing facility or new facility
Hood River At Tucker Bridge Observed (black) Simulated (blue) +80 cfs +50 cfs -70 cfs • Winter averages: simulated slightly higher than observed • Summer averages: simulated slightly lower than observed • Using average demands across the basin (recent 5 – 10 years) • Overall: <5% error
West Fork Near Dee Observed (black) Simulated (blue) -80 cfs +10 cfs 0cfs • Simulated averages match observed very well • Simulated peaks slightly lower than observed peaks (winter months) • Insignificant implications • Overall: < 5% error
Laurance Lake • General monthly pattern captured • Average storage volumes slightly lower than observed (2000 – 2009) • Using average reservoir releases (2008 – 2012) • Overall: ~ 5% error -300 ac-ft -200 ac-ft
Upper & Lower Green Point Reservoirs • General monthly pattern captured • Assumes: • Filling mid-March through May • Releasing June through September • Constant release rate • Overall: < 5% error -100 ac-ft +40 ac-ft
Flow Comparisons Across Alternatives • Projected future climate change expected to: • “Compress” high flows • Potentially earlier in time and greater in magnitude • “Skew” low flows • Likely earlier in time and lower in magnitude
Flow Comparisons Across Alternatives • Water resource alternatives modeled to primarily impact summer flows • Increased demands • Further decrease flows • Conservation measures, additional storage • Mitigate, or potentially eliminate, decreases
Flow Comparisons Across Alternatives • Most significant improvements along: • East Fork • Greatest downstream impact (i.e. Hood River At Tucker Bridge)
Flow Comparisons Across Alternatives 40 cfs 40 cfs • Most significant improvements along: • East Fork • Greatest downstream impact (i.e. Hood River At Tucker Bridge)
Flow Comparisons Across Alternatives • Less notable improvements along: • Middle Fork • West Fork
Flow Comparisons Across Alternatives • Less notable improvements along: • Green Point Creek • Neal Creek
Consumptive Use Comparisons Across Alternatives • Projected future climate change may affect MHID and EFID* • Other districts not modeled to have water availability issues • *Dependent on 2 cfs minimum flow requirement downstream of Main Canal POD • Same priority date as MHID and EFID senior rights • Shortages sensitive to water resource alternatives • Increased demands likely to amplify shortages • Conservation measures, additional storage may mitigate, or eliminate, shortages
Minimum Flow Comparisons Across Alternatives 250 cfs right (1993) • Similar story for minimum flows . . . • Projected future climate change expected to affect: • Mainstem, East Fork, and Middle Fork headwaters • Shortages sensitive to water resource alternatives • Increased demands likely to amplify shortages • Conservation measures, additional storage may mitigate, but not eliminate, shortages
Minimum Flow Comparisons Across Alternatives 100 cfs right (1983) • Similar story for minimum flows . . . • Projected future climate change expected to affect: • Mainstem, East Fork, and Middle Fork headwaters • Shortages sensitive to water resource alternatives • Increased demands likely to amplify shortages • Conservation measures, additional storage may mitigate, but not eliminate, shortages
Minimum Flow Comparisons Across Alternatives • Similar story for minimum flows . . . • Projected future climate change expected to affect: • Mainstem, East Fork, and Middle Fork headwaters • Shortages sensitive to water resource alternatives • Increased demands likely to amplify shortages • Conservation measures, additional storage may mitigate, but not eliminate, shortages
Hydropower Comparisons Across Alternatives Still working on this . . . • Power production may increase, generally by less than 5% • Increased consumptive demands (3 – 8%) may be carried through power plants • Water conservation decreases consumptive demands, but flows through plants maintained • Additional storage not much of a factor
Storage Comparisons Across Alternatives • Projected future climate change expected to: • Decrease storage during irrigation season Potentially by more than 50% • Increase storage during off-season Potentially by more than 20%
Storage Comparisons Across Alternatives • Changing demands not modeled to significantly impact existing storage facilities • However, additional capacity may provide increased water availability for acute low flow periods • Laurance Lake: • Slight improvement in downstream shortages with expansion ~ 1 cfs extra flow • Additional capacity (+ 370 acre-ft) may provide 10+ cfs for critical two week window • Upper Green Point Reservoir: • No downstream shortages to alleviate • Additional capacity (+ 560 acre-ft) may provide 15+ cfs for critical two week window
Storage Comparisons Across Alternatives ½ DHSVM inflows DHSVM inflows • Proposed Neal Creek Reservoir may serve significant role • Fill during Jan – Apr • Release during Jun – Sep • May provide up to 10 cfs to EFID during irrigation season • Allow more water to remain in East Fork and mainstem
Flow Comparisons Across Scenarios • Water conservation may increase flows 10 – 15% along mainstem during Jul – Sep period • Approximately 20 – 40 cfs
Flow Comparisons Across Scenarios • Water conservation may increase flows < 10% along Middle Fork during Jul – Sep period • Less than 5 cfs
Flow Comparisons Across Scenarios • Water conservation may increase flows < 5% along West Fork during Jul – Sep period • Less than 5 cfs
Flow Comparisons Across Scenarios • Water conservation may increase flows 30 – 60% along East Fork during Jul – Sep period • Approximately 20 – 40 cfs
Summary • Projected climate change expected to alter runoff timing and character • Potentially higher flows during the winter (+10 – 20%) and lower flows during the summer (-20 – 30%) • Water shortages, namely along East Fork and mainstem, are enhanced • Storage in existing facilities likely to decrease during irrigation season • Projected increase in demands likely to exacerbate water availability issues • Proposed conservation practices may mitigate, or eliminate, some demand issues • Namely along East Fork and mainstem • Additional storage in existing facilities may provide buffer to acute low flow periods • Expansion of Laurance Lake and Upper Green Point Reservoir could yield + 30 cfs for two weeks • New storage facility along Neal Creek may provide most notable benefit to flows and shortages • Could serve district(s) modeled to have biggest water availability issues • Could keep more East Fork flow in-channel and allow to pass down
Biggest Unknowns • Low elevation tributary flows • Green Point Creek, Dead Point Creek, Pine Creek, Ditch Creek, Neal Creek • Flow observations not available for model calibration • Farmers Irrigation District (FID) • Uncertainty in inflows translates to uncertainty in water availability for storage, consumptive use, hydropower, and minimum flows • Fine-tuning PODs, POUs, and the timing and quantity of demanded water may yield more expected results • Potential Neal Creek Reservoir • Uncertainty in inflows translates to uncertainty in water availability for storage and augmenting EFID • However, even half of projected inflows may provide water to EFID and keep water in-channel
Acknowledgements • Reclamation would like to thank everyone involved for helpful guidance and feedback • Specifically, for their extensive efforts: • Niklas Christensen, Watershed Professionals Network • Mattie Bossler, Hood River County • University of Washington Dept. of Civil and Environmental Engineering
Flow Comparisons Across Alternatives • Water resource alternatives modeled to primarily impact summer flows • Increased demands • Further decrease flows • Conservation measures, additional storage • Mitigate, or potentially eliminate, decreases
Minimum Flow Comparisons Across Alternatives • Projected future climate change expected to affect: • Mainstem, East Fork, and Middle Fork headwaters • Other flow targets not modeled to have water availability issues • Shortages sensitive to water resource alternatives • Increased demands likely to amplify shortages • Conservation measures, additional storage may mitigate, but not eliminate, shortages