Download
1 / 11
110 likes | 115 Views
Ultrasonic Attenuation Tomography Based on Log-Spectrum Analysis. Radovan Jiřík , Rainer Stotzka, Torfinn Taxt. Brno University of Technology Department of Biomedical Engineering Brno, CZECH REPUBLIC. Forschungszentrum Karlsruhe Institute for Data-Processing and Electronics

E N D
Ultrasonic Attenuation TomographyBased on Log-Spectrum Analysis Radovan Jiřík, Rainer Stotzka, Torfinn Taxt Brno University of Technology Department of Biomedical Engineering Brno, CZECH REPUBLIC Forschungszentrum Karlsruhe Institute forData-Processing and Electronics Eggenstein, GERMANY University of Bergen Department of Biomedicine Bergen, NORWAY
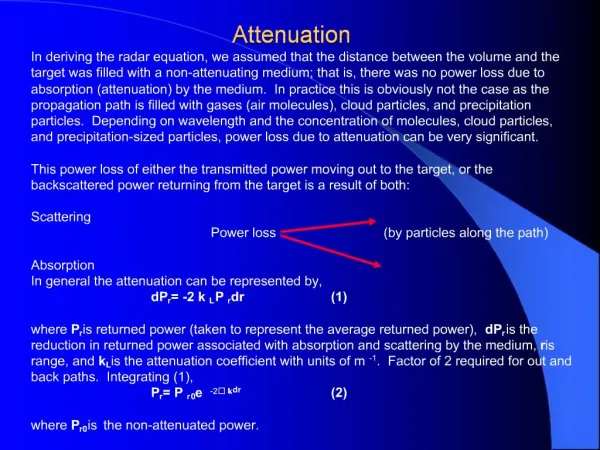
1. Introduction Aim: ultrasonic attenuation tomography for breast cancer diagnosis using
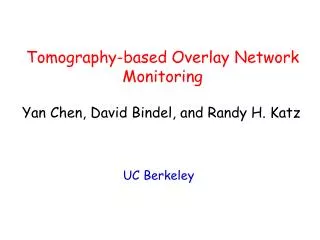
1. Introduction • B-mode ultrasonic imaging • low spatial resolution • low contrast • Ultrasound computed tomography • more data available • more complicated acquisition and signal processing • Ultrasound attenuation imaging • att. coef. closely related to tissue type and pathology • tomography setup possible for mammography • correction of reflection tomography images • standalone imaging modality
undirected beam { 1. Introduction Main idea: processing of reflected / scattered signal sending transducer s(t) l t { tl = l / c receiving transducer Initial study presented
mean attenuation coefficient 2. Model of RF signal Directly transmitted signal sending transducer s(t) l t { tl = l / c receiving transducer FFT S(w,l)
s(t) t 2. Model of RF signal Reflected / scattered signal sending transducer l2 { l1 FFT receiving transducer S(w,l1+l2)
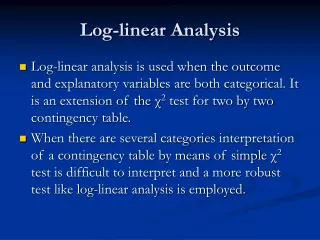
0 w0 w 0 w0 w 3. Method Segment of reflected / scattered signal - amplitude spectrum: Log-spectrum: Modified log-spectrum: Linear regression => (mean attenuation coefficient along the path l1+l2)
y { x In the end – mean of the cumulated values calculated { { { 3. Method For each pixel - all combinations of sending and receiving positions
3. Method • Method analysis • All segments with the contribution of the computed pixel cumulated • Contribution of other pixels does not average out • Values shifted closer to the mean attenuation coefficient in the image • Influence of neighboring pixels • Estimation of : for non-sparse reflectors / scatterers log-spectrum not a linear function, but still a monotonous function
4. Results New attenuation imaging technique Standard unfiltered backprojection
5. Conclusion • Not only directly transmitted signal processed, reflected / scattered signal used in addition => significantly more data • Attenuation images with less geometry distortion than the backprojection algorithm • Simplifying assumptions used • Further research • huge set of linear / nonlinear equations • “Filtered backprojection” algorithm for non-straight propagation lines ??? • More complete model (non-sparse reflectors / scatterers)