Download
1 / 22
220 likes | 322 Views
Multitemporal and angular information. Monitoring of biomass burning using NASA MODIS algorithm developed byRoy and Lewis consideration of spectral, angular, and multitemporal information summary of talk by Roy & Lewis.

E N D
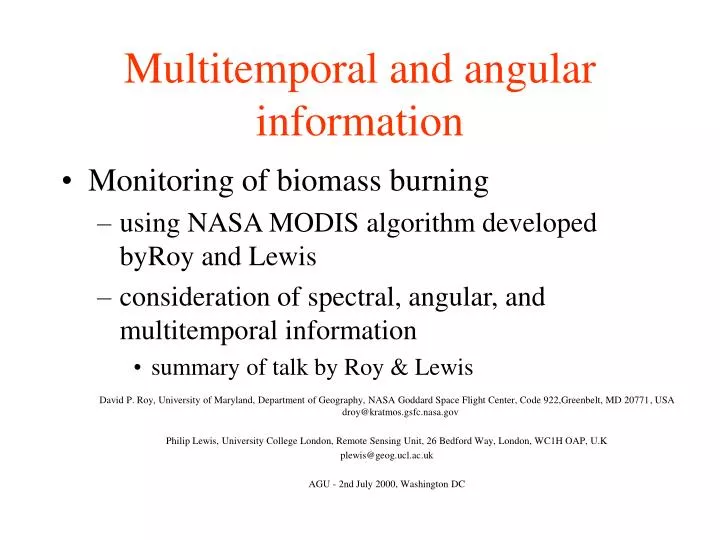
Multitemporal and angular information • Monitoring of biomass burning • using NASA MODIS algorithm developed byRoy and Lewis • consideration of spectral, angular, and multitemporal information • summary of talk by Roy & Lewis David P. Roy, University of Maryland, Department of Geography, NASA Goddard Space Flight Center, Code 922,Greenbelt, MD 20771, USA droy@kratmos.gsfc.nasa.gov Philip Lewis, University College London, Remote Sensing Unit, 26 Bedford Way, London, WC1H OAP, U.K plewis@geog.ucl.ac.uk AGU - 2nd July 2000, Washington DC
Burned area mapping: rationale • Global change research • estimates of trace gas and particulate emissions (CO2, CO, NOx, CH4, aerosols) for climate modeling and for IPCC/FCCC • Biomass burned (g) = burned area (m^2) * fuel load (g/m^2) * completeness of combustion • Emission of gas(g/Kg fuel consumed) = biomass burned (g) * emission factor (g/Kg) • [these vary spatially and temporally as fuel mixture changes] • understanding biophysical processes, particularly loss of biomass and release of carbon and greenhouse gasses to the atmosphere - carbon and nitrogen cycles - biogeochemical and ecosystem modeling • fire frequency can be expected to change with climate change and variability • Fire is a proximate cause / indicator of land cover change • fire is an important ecological disturbance regime • fire is a major land management practice in tropical systems • fire frequency will change with population dynamics • Fire can be a natural hazard with large societal costs and impacts • economic damage, air quality, health • early warning, management and long term monitoring of wildfires
Overview • active fire detection at regional to global scales using moderate spatial resolution satellite data has considerable heritage (e.g., AVHRR, ATSR, GOES, DMSP with MODIS active fire products to be released August 2000). • active fire detection cannot be used as a reliable surrogate for burned area as the majority of fires are not detected at the time of satellite overpass • Goal: develop burned area algorithm applicable to moderate spatial resolution polar orbiting satellite sensing systems • Prototyping using 1Km AVHRR • MODIS implementation under testing • Evaluation & validation using Landsat ETM focused on Southern Africa (SAFARI 2000)
NOAA-11 AVHRR LAC data (1.1km pixels) September 1989. Red indicates the positions of active fires NDVI provides poor burned/unburned discrimination Smoke plumes >500km long An active burn near the Okavango Delta, Botswana
Landsat ETM (30m pixels, RGB wavelengths) August 1999 Evident variation of burned scar coloring (related to scar age, fire intensity, type of material burned etc.) Bright white Kalahari sand revealed as vegetation is burned off An active burn Mongu, Zambia
patch ~2m wide partial burning & differing degrees of combustion completeness Brown dry unburned vegetation Green unburned vegetation Black char White ash Photograph of burned vegetation
Burned areas Characterized by • the removal of vegetation and alteration of its structure • deposits of charcoal and ash • exposure of the soil layer These vary temporally and spatially because of • the type of vegetation that burns (landcover) • the completeness of the burn • the rate of charcoal and ash dissipation by the elements • the post fire evolution and revegetation of the burned area
Burned area mapping should be treated as a change detection problem Burning is a temporal phenomenause multi-temporal data Select wavelength(s) sensitive to changes in the “burn signal” and insensitive to atmospheric contamination (e.g. smoke) Threshold temporal changes in reflectance for each pixel rather than setting a fixed threshold for all pixels in a single data set (threshold against the magnitude and direction of change) Central Issue: • How to define the the magnitude of spectral change associated with vegetation to burned vegetation conversion, given sensitivity to • spatial and temporal variations of burned areas, • variations in the proportion of the pixels that are burned, • external variations imposed by the remote sensing (residual atmospheric and cloud contamination, BRDF) • How to do this globally and independent of the time of year ?
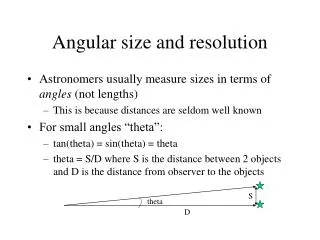
Approach: BRDF • Bidirectional Reflectance Distribution Function (BRDF) describes how reflectance depends on the view and solar angles. • Non-Lambertian (BRDF) effects significant for vegetation monitoring at regional to global scales. • Source of noise if not accounted for • BRDF effects may be modelled • invert BRDF model against satellite observations and use model parameters to give normalised values at fixed view and solar angles. • BRDF model parameters may be used to predict satellite observation values through time. • Large discrepancies between the predicted and measured values may be attributed to • change or • residual cloud and atmospheric contamination.
Kernel-based BRDF models • can describe BRDF with simple kernels: • linear model • kernels based on abstraction of physically-based models operate on reflectance • 3x3 matrix inversion (fast) • implicit modelling of sub-pixel heterogeneity i.e., can model different cover types within the pixel (e.g., partially burned pixels) • can predict uncertainty in model parameters or linear combinations • used to examine influence of MODIS/MISR sampling patterns (Lucht & Lewis, IJRS, 2000)
BRDF View zenith Multitemporal BRDF-based Change Detection • Model BRDF over moving window (T-NW to T) • Predict BRDF of next observation (T+1) • Predict uncertainty in model result • Produce Z-score between actual and predicted observation to detect probability of CHANGE I.e., Z-score = predicted - observed reflectance / model uncertainty • Threshold Z-score time series
Data • 54 AVHRR LAC (1km) orbits: August 1- August 31 1997 • Pre-processing by state of the art Pathfinder II code • Use the reflective component of the middle-infrared (r3) • sensitive to the presence of liquid water (vegetation and soil water content is reduced by burning) • less sensitive to scattering by smoke aerosols than shorter wavelengths • discriminates between burned and unburned surfaces • AVHRR channel 3 (3.55-3.93 m)
Image ofAll of Southern Africa single day in August • Points • 3001*3001 1km pixels • BRDF effects apparent across orbit edges • Gaps where cloudy and poor R3 retrieval data discarded • Huge burn ~200km south of Okavago delta in Botswana
Algorithm • 10-day moving window • RossThick-LiSparseReciprocal model inversion for 6 or more observations • Change candidate if at least one subsequent observation over the next 3 days pass and none fail • Pass: Z-score >= Zthresh • Fail: Z-score < Zthresh • Final change candidate is the one with largest Z-score > Zthresh
Illustration of a single step of the moving window Top left R3 predicted from days 226-235 Top Right R3 sensed day 236 Bottom Z-score (rainbow scale: blue 1, red 3+) Botswana (approximately 300 * 300km)
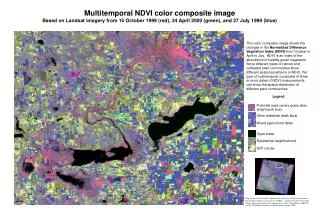
Zthresh = 2.0 LeftMaximum Z-score over 30 day period (rainbow scale: blue 1, red 12.0+) Right Day when Maximum Z-score occurred (rainbow scale: blue beginning of month, red towards end of month) Botswana (500 * 500km)
Zthresh = 4.0 LeftMaximum Z-score over 30 day period (rainbow scale: blue 1, red 12.0+) Right Day when Maximum Z-score occurred (rainbow scale: blue beginning of month, red towards end of month) Botswana (500 * 500km)
Compute heavy algorithm - search for best Zthresh LeftDay when Maximum Z-score occurred Right Day active fire detected over same period (rainbow scale: blue beginning of month, red towards end of month)
Pixels labeled based on sign of: {nadir R3 predicted before change date - nadir R3 predicted after change date} green : change/burned red : change/not burned black : no change blue : unknown (insufficient observations predicted before and after R3)
Conclusions • This approach • maps the burned area and the approximate date that burning occurred • removes the need for poorly understood reflectance thresholds which are sensitive to the spatial and temporal variations of burned areas • BRDF variations implicit • MODIS implementation ongoing • Evaluation & validation under auspices of SAFARI 2000 dry season campaign • Burn scars interpreted on Landsat ETM images for study areas representing different fire regimes in Southern Africa • dry regions ~ large less spatially fragmented fires • humid regions ~ small and fragmented fires