Download
1 / 24
240 likes | 351 Views
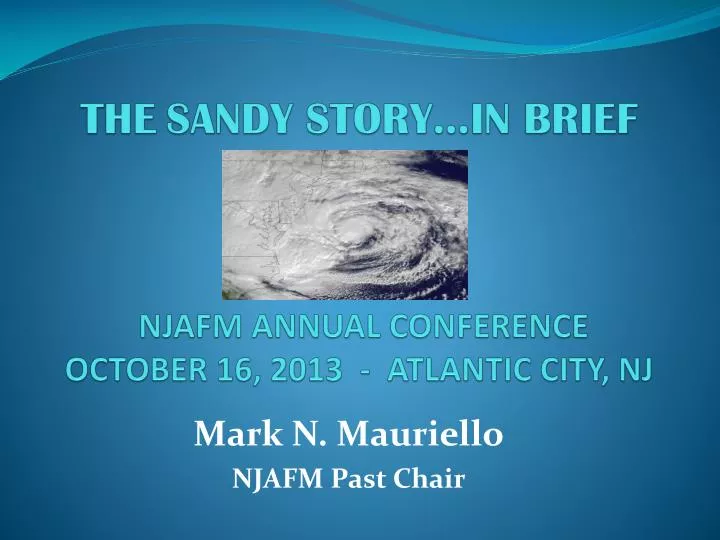
THE SANDY STORY…IN BRIEF NJAFM ANNUAL CONFERENCE OCTOBER 16, 2013 - ATLANTIC CITY, NJ. Mark N. Mauriello NJAFM Past Chair. COASTAL STORM HAZARD VULNERABILITY FACTORS. SEA LEVEL RISE EXPANDING FLOOD HAZARD AREAS INCREASING FLOOD HEIGHTS NEGATIVE SEDIMENT BUDGETS

E N D
THESANDY STORY…IN BRIEF NJAFM ANNUAL CONFERENCE OCTOBER 16, 2013 - ATLANTIC CITY, NJ Mark N. Mauriello NJAFM Past Chair
COASTAL STORM HAZARDVULNERABILITY FACTORS • SEA LEVEL RISE • EXPANDING FLOOD HAZARD AREAS • INCREASING FLOOD HEIGHTS • NEGATIVE SEDIMENT BUDGETS • DEVELOPMENT DENSITY…LARGE NUMBER OF PEOPLE AND PROPERTIES AT RISK • NATURAL RESOURCE IMPAIRMENTS • EXTREME WEATHER
SEA LEVEL RISE SCENARIOS USACE 2011: Sea-Level Change Considerations for Civil Works Programs NOAA 2012: Global Sea Level Rise Scenarios for the United States National Climate Assessment
NEGATIVE SEDIMENT BUDGETSCHRONIC SHORELINE EROSION & RETREAT SEA ISLE CITY MONMOUTH BEACH
VULNERABLE COMMUNITIES NJ LANDSAT LAND USE/LAND COVER
SANDY…BY THE NUMBERS • Record Low Barometric Pressure: 940 Millibars (1,013.25 Normal)/27.76 Inches (29.92 Normal) • Record Storm Surge: 13.9 Feet in Lower Manhattan; >13.5 Feet at Sandy Hook (1,000-year storm/0.001%) • Record Wave Height in NY Harbor: 32.5 feet • Landfall Coincided With High Tide and Full Moon • Wind Field Diameter: 1,000 Miles • Damage Estimate: > $71 Billion • Second Costliest US Hurricane (Katrina #1)